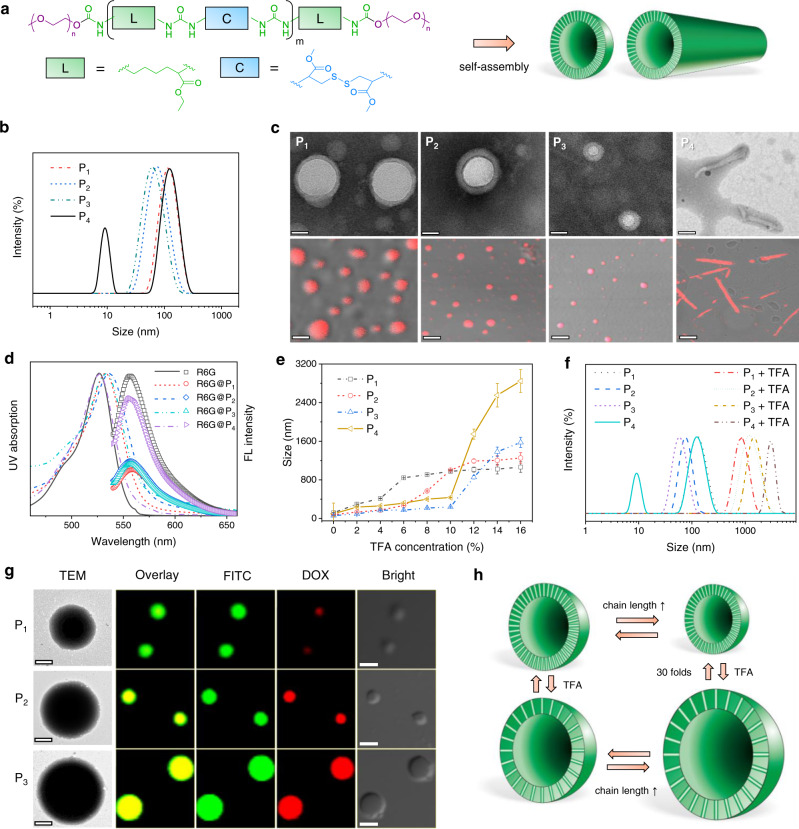
Fig. 1. Self-assembly of PUs.
a Schematic illustration of PUs and their assemblies. b Size distribution profiles of PUs determined by dynamic light scattering (DLS). c TEM (upper) and CLSM (lower) images of PU assemblies. The scale bars in TEM images are 50 nm and full TEM images are shown in Supplementary Fig. 10. For CLSM, the assemblies were encapsulated with DOX·HCl (red). The scale bars are 100 nm. Experiments were repeated three times independently with similar results. d UV–vis spectra (left) and fluorescence emission spectra (right, λex = 526 nm) of R6G dissolved in water and those encapsulated in PU assemblies (R6G@PUs) at the same concentration. e Size changes of PU assemblies treated with different concentrations of TFA. Data are presented as the mean ± standard deviation (SD) (n = 3 independent measurements). f Size distributions of PU assemblies before and after TFA treatment (16 v%). Experiments were repeated three times independently with similar results. g TEM (left) and CLSM (right) images of PU assemblies treated with TFA. For CLSM, the assemblies were loaded with DOX·HCl (red) and FITC (green). The scale bars are 0.5 and 2 μm for TEM and CLSM, respectively. Experiments were repeated three times independently with similar results. h Schematic illustration of PU vesicles with or without TFA treatment.

