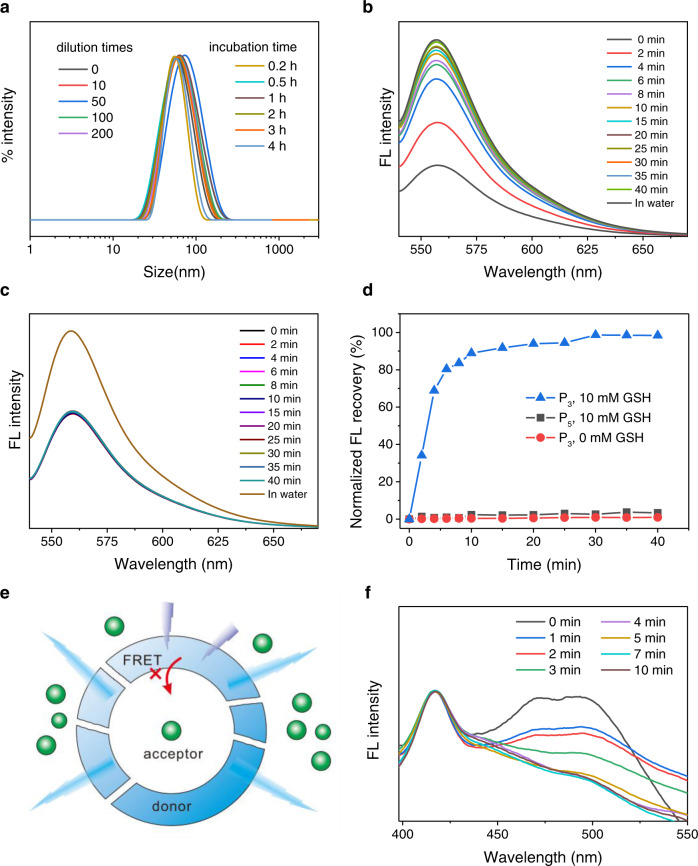
Fig. 4. Ultrahigh stability and superfast responsivity.
a Size distribution of P3 assemblies diluted with water for different times and those incubated with SDS (0.02 M) for different times. b, c Fluorescence spectra (λex = 526 nm) of R6G-loaded P3 (b) and P5 assemblies (c) incubated with 10 mM of GSH for different times. d Release profiles of R6G from PU assemblies in the media with or without 10 mM of GSH. e Schematic illustration of drug release monitored by the FRET effect between the donor (PU assemblies) and the encapsulated acceptor (QD). f Fluorescence spectra of QD-loaded PU assemblies incubated with 10 mM of GSH for different times.

