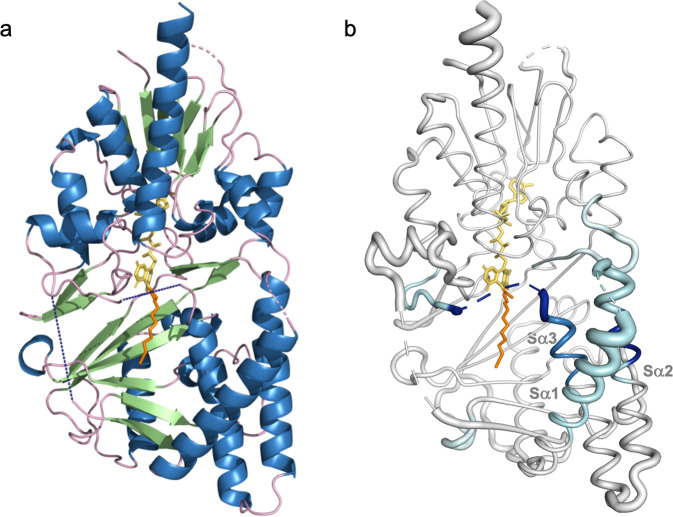
Fig. 3. Crystal structure of ehSMOX and HDX-MS.
a Structure of ehSMOX with FAD in yellow sticks and MDL72527 in orange sticks. The blue dashed lines represent undefined residues 81–97 (on the left) and 190–210 (in the center). b HDX-MS signature differences between apo hSMOX and hSMOX bound to MDL75257 overlaid onto a putty representation (areas with increased diameter correlate with higher B-factors; the dotted blue line represents residues 190–210) of hSMOX; decreased deuterium uptake upon MDL72527 binding, is depicted with a color spectrum from cyan to dark blue with increased protection.

