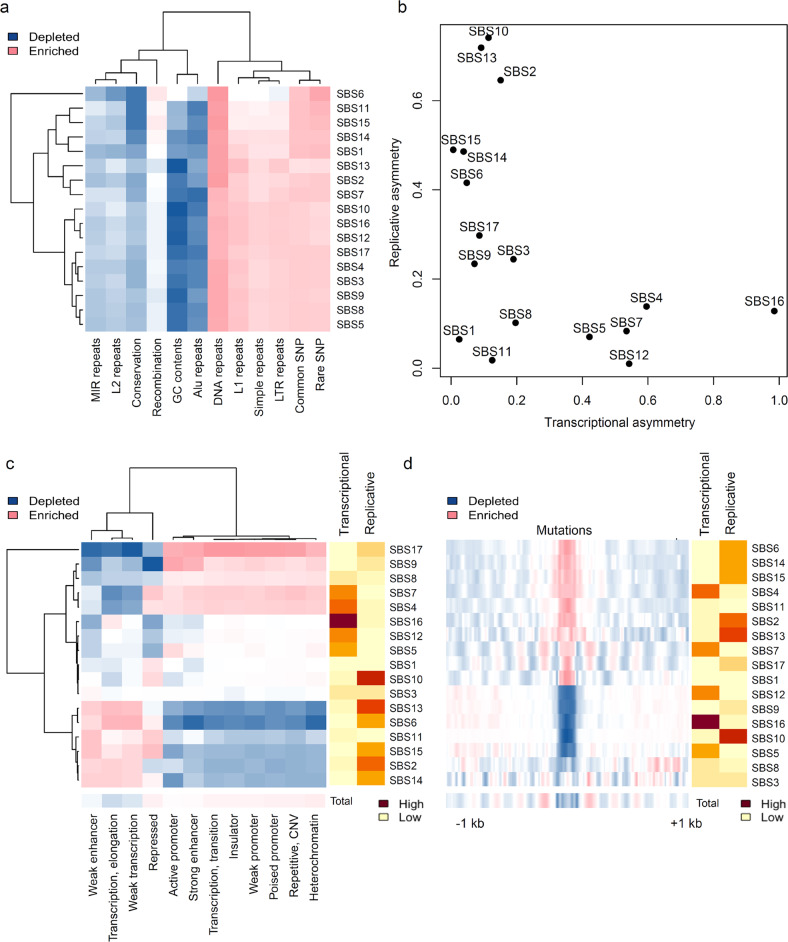
Fig. 2. Genetic and epigenetic correlation of mutation signatures with respect to mutational strand asymmetries.
a Mb-bin-scaled correlations of 12 genetic features with the densities of mutation signatures are shown in a heatmap. b Levels of transcriptional and replicative strand asymmetries (x- and y-axes, respectively) are plotted for the mutation signatures. c The mutation density with respect to 12 chromHMM states and mutation signatures is shown in a heatmap. Levels of mutational strand asymmetries (transcriptional and replicative asymmetries) are also shown in a heatmap. d Nucleosome positioning signals measured across mutation-centric 2-kb windows (1 kb up- and downstream) are shown in a heatmap aligned with mutational strand asymmetries.

