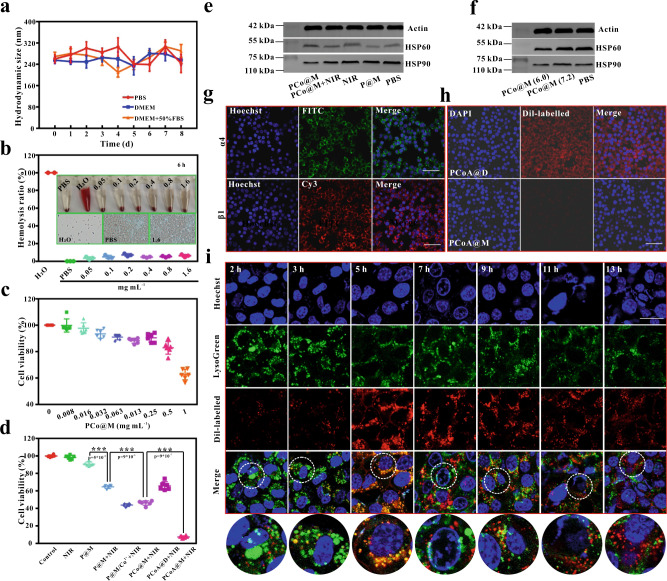
Fig. 3. Biocompatibility and targeting of the probes at the cellular level.
a Hydrodynamic particle size of PCoA@M over time in different media. Data are presented as the means ± s.d. (n = 3 independent samples). b Haemolysis rate of erythrocytes after incubation with different concentrations of probe. Inset: bright field image and micrograph of the cell smear made with the precipitate after incubation. c CCK-8 cytotoxicity of 4T1 cells incubated with different concentrations of PCo@M. Data are presented as the means ± s.d. (n = 6 independent samples). d Survival rate of 4T1 cells incubated and treated with different probes. Data are presented as the means ± s.d. (n = 6 independent samples). Statistical differences were calculated using two-tailed Student’s t test, *: p < 0.05; **: p < 0.01; ***: p < 0.001. e, f Western blot analysis of HSP after treating 4T1 cells with different probes and at different pH values. g Immunofluorescence imaging for the detection of α4 and β1 antigens on the macrophage membrane. Images are representative of three biologically independent samples. Scale bar: 50 μm. h Confocal imaging of Dil-labelled PCoA@M and PCoA@D incubated with RAW 264.7 cells for 5 h. Scale bar: 50 μm. i Colocalized images of Dil-labelled PCoA@M and 4T1 cells incubated for 2, 3, 5, 7, 9, 11, and 13 h. Scale bar: 50 μm.

