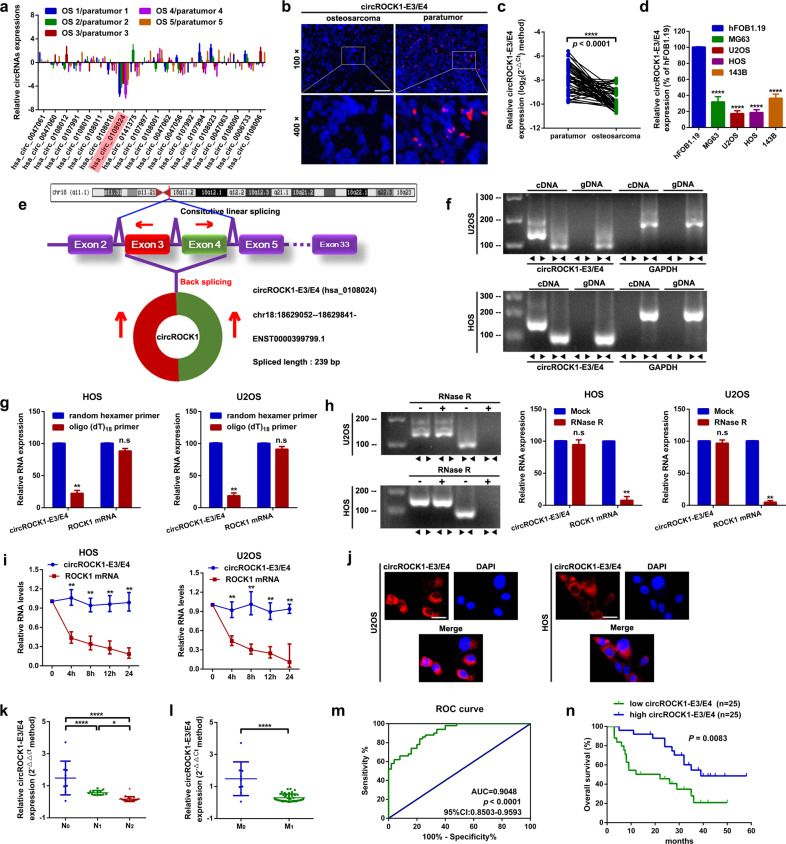
Fig. 1. CircROCK1-E3/E4 is downregulated and associated with poor prognosis in patients with osteosarcoma.
a The expression of certain ROCK1-derived circRNAs in osteosarcoma tissue specimens and paired paratumor tissue specimens was determined by an RT–qPCR assay. b Representative images of circROCK1-E3/E4 expression in osteosarcoma and paratumor tissues as displayed by a FISH assay. c The expression of circROCK1 in 50 osteosarcoma and paired paratumor tissue specimens was detected by RT–qPCR assay. ****p < 0.0001. d CircROCK1-E3/E4 was downregulated in osteosarcoma cell lines, as confirmed by an RT–qPCR assay. ****p < 0.0001. e CircROCK1-E3/E4 is circularized from exons 3 and 4 in ROCK1, as demonstrated by a schematic illustration. f CircROCK1-E3/E4 was amplified by divergent primers in cDNA but not gDNA by using GAPDH as a negative control, as validated by an RT–qPCR assay. g Compared with oligo (dT)18 primers, the expression of circROCK1-E3/E4 was significantly decreased when random hexamer primers were applied. n.sp > 0.05 and **p < 0.01. h Compared with linear ROCK1 mRNA, the expression changes of circROCK1-E3/E4 were unremarkable in the presence of RNase R. n.sp > 0.05 and **p < 0.01. i The RNA levels of circROCK1-E3/E4 and ROCK1 mRNA after 2 μg/ml actinomycin D treatment were quantified at different time points by qRT–PCR assays. **p < 0.01. j CircROCK1-E3/E4 was mainly localized in the cytoplasm of U2OS and HOS cells. k CircROCK1-E3/E4 is frequently downregulated in patients with lymph node metastasis (N1 and N2). *p < 0.05, ****p < 0.0001. l CircROCK1-E3/E4 is downregulated in patients with distant metastasis (M1 stage). ****p < 0.0001. m ROC curve analysis of the area under the curve (AUC) and 95% confidence interval (CI) of circROCK1-E3/E4 in patients with osteosarcoma. n A low expression level of circROCK1-E3/E4 was correlated with shorter survival rates in patients with osteosarcoma as determined by Kaplan–Meier analysis. All data are presented as the mean ± SD from three independent experiments.

