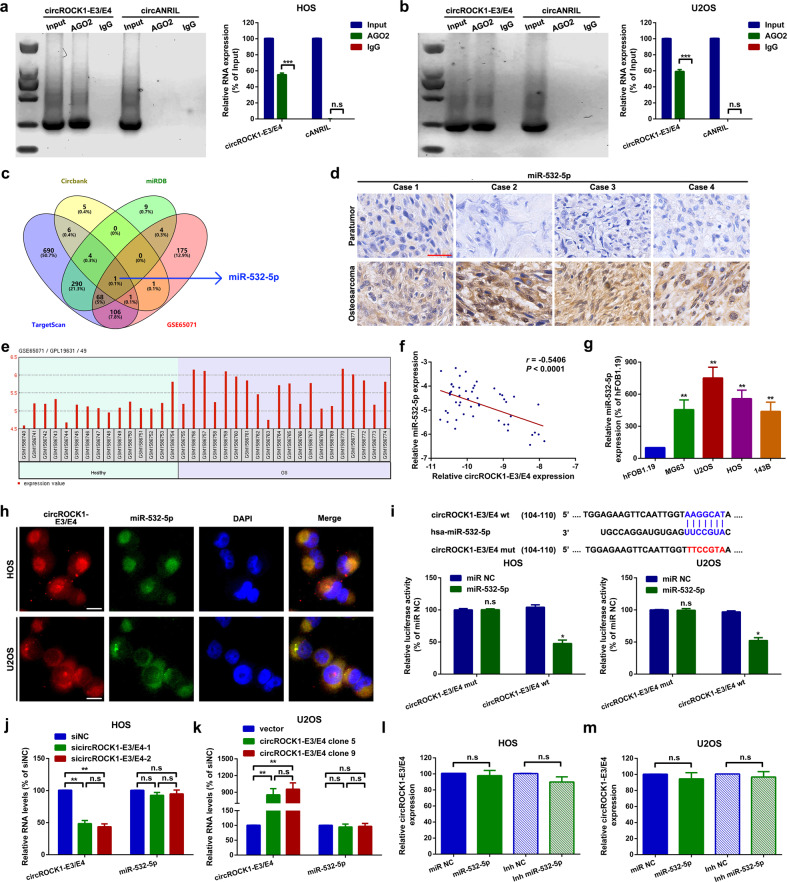
Fig. 4. CircROCK1-E3/E4 sponges miR-532-5p in U2OS and HOS cells.
a, b Compared with circANRIL, circROCK1 was abundantly enriched in AGO2 by using IgG as an internal control. n.sp > 0.05 and ***p < 0.001 c A Venn diagram exhibiting overlapping miRNAs that might interact with circROCK1-E3/E4 and presented in GSE65071. d Expression of miR-532-5p in osteosarcoma tissues was illustrated by an in situ hybridization assay. e Expression of miR-532-5p in osteosarcoma tissues and paired healthy tissues in the osteosarcoma-related genome-wide study GSE65071. Probe ID 49 represents miR-532-5p. f Spearman correlation analysis showed that circROCK1-E3/E4 was inversely correlated with miR-532-5p. r = –0.5406 and p < 0.0001. g Expression levels of miR-532-5p in osteosarcoma cell lines were confirmed by an RT–qPCR assay. h The subcellular localization of circROCK1-E3/E4 and miR-532-5p was confirmed by a FISH assay. i The targeted binding effect and binding sites between circROCK1-E3/E4 and miR-532-5p were tested by a luciferase assay. n.sp > 0.05 and *p < 0.05. j, k Expression of miR-532-5p after up- and downregulation of circROCK1-E3/E4 was analyzed by RT–qPCR. n.sp > 0.05 and **p < 0.01. l, m Relative expression of circROCK1-E3/E4 after different miR-532-5p interventions was measured by RT–qPCR. n.sp > 0.05. All data are presented as the mean ± SD from three independent experiments.

