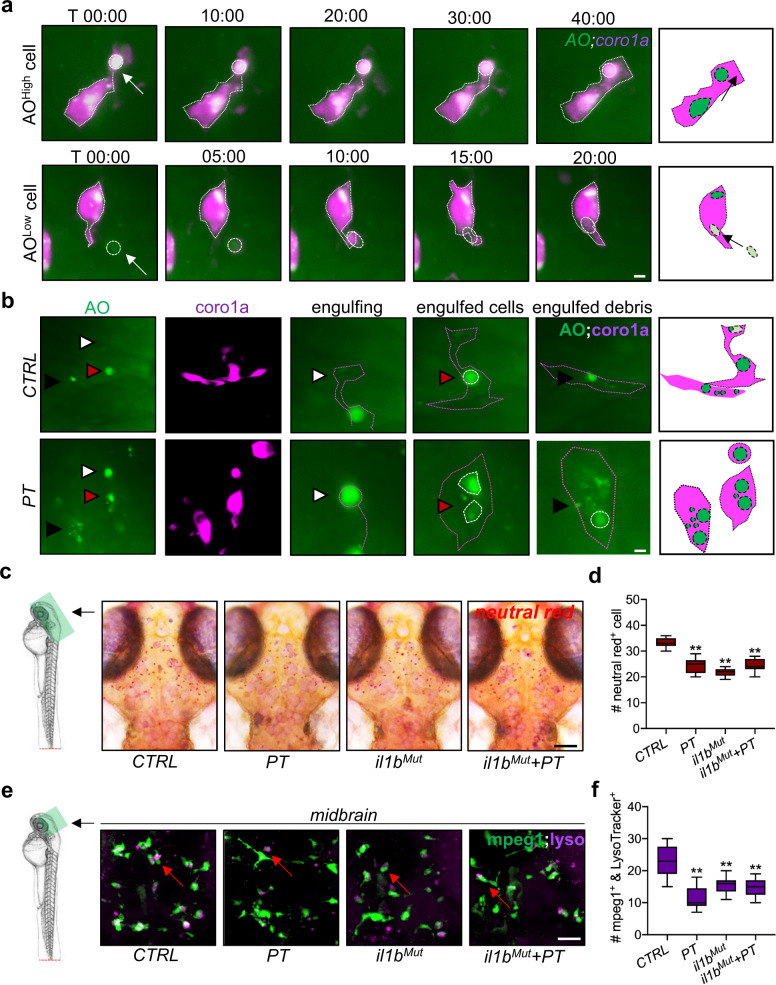
Fig. 6. Microglial lysosome impairment may account for the leukocyte invasion of the brain.
a, b Time-lapse light-sheet imaging showed the phagocytosis of AOhigh and AOlow cells (white arrow or arrowhead) by coro1a + leukocytes in the zebrafish brain at 1 dpt. c, d Neutral red staining showed microglial lysosome impairment in zebrafish brains with or without il1b mutation at 1 dpt. Two-way ANOVA with Tukey’s HSD post hoc test, **, p < 0.01 compared to CTRL. Scale bar, 40 µm. e, f LysoTracker staining showed mpeg1 + microglial lysosome impairment in the zebrafish brain at 1 dpt or under il1b mutation. Two-way ANOVA with Tukey’s HSD post hoc test, **, p < 0.01 compared to CTRL. Scale bar, 20 µm.

