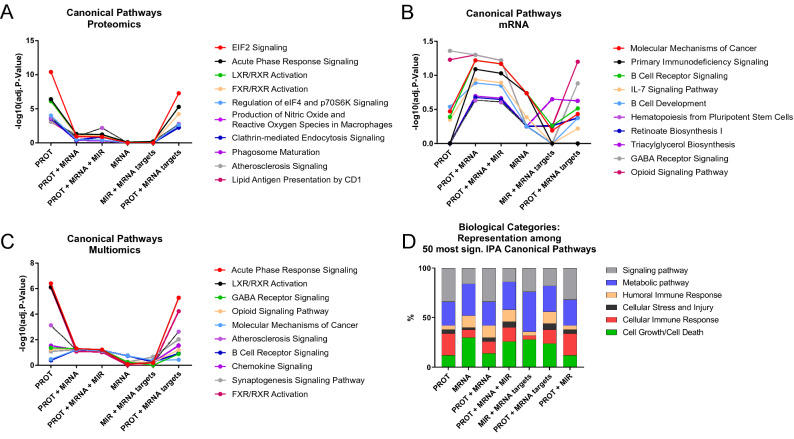
Figure 2.
Different omics analyses result in different pathway signatures. Adjusted p-values of the 10 pathways with highest significance in the respective analyses were comparatively evaluated. Statistical significance is reached at − log10(adj. p-value) > 1.3 (i.e., adj. p-value < 0.05). We compared the pathway analysis results of the ten pathways with the lowest adjusted p-values from: (A) proteomics alone (PROT), (B) mRNA-seq alone (MRNA), and (C) multiomics analysis (PROT + MRNA + MIR). The large differences in adjusted p-value differences between PROT and MRNA in A and B are consistent with very disparate results for their respective pathway signature. (D) Percentages of the biological categories attributed to the 50 most significantly affected pathways captured by proteomics, mRNA, and miRNA or their combinations.

