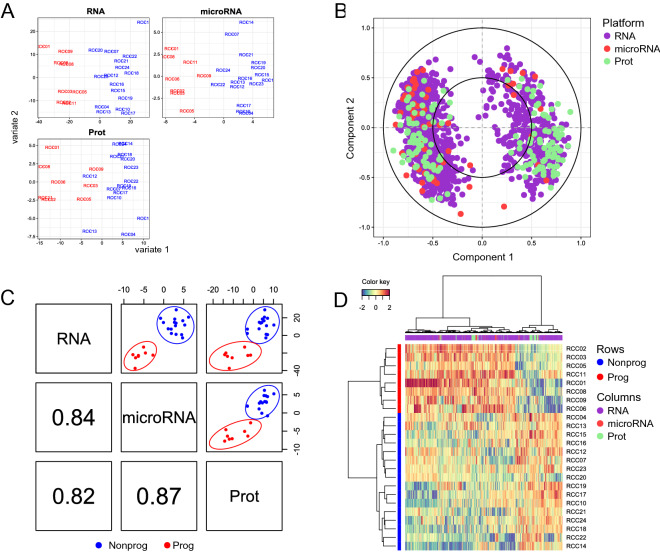
Figure 3.
Multiomics integration. Sparse PLS-DA (sPLS-DA) for RNA, miRNA and protein datasets with respective differentially expressed features support the expected separation of sample groups on the first component (A). The correlation circle plot (B) displays the correlation between variables (biological features) and latent components. Each variable coordinate is defined as the Pearson correlation between the original data and a latent component58. The contribution to the definition of each component is visualized as closeness to the circle with radius 1, as well as the correlation structure between variables (clusters of variables). The cosine angle between any two points represents the correlation (negative, positive or null) between two variables. A global overview of the correlation structure for component 1 is shown in (C). A strong correlation is detectable for each dataset combination, the strongest being for the combination RNA/microRNA. (D) Clustered Image Map (CIM) showing two clusters of samples (rows) and two main clusters of over- and underrepresented features from all three data sources. CIM is based on a hierarchical clustering simultaneously operating on the rows and columns of the selected variables in the original data, here reported by using Euclidian distance and complete linkage.

