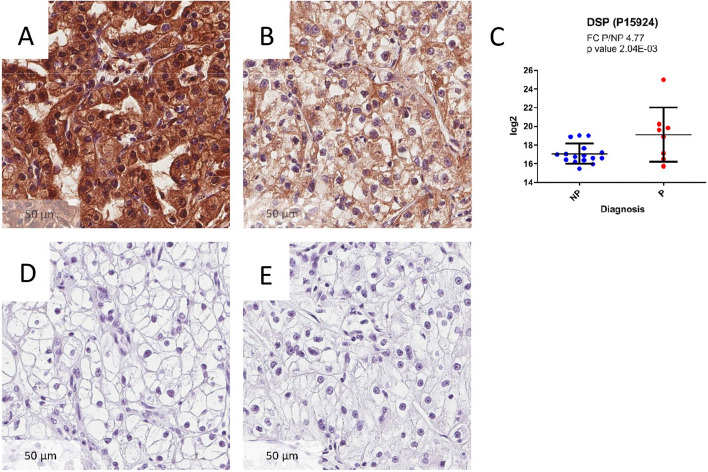
Figure 5.
Immunohistochemistry (IHC) of Desmoplakin (DSP) and its protein abundance plot. DSP was expressed to a higher extend in P (A), compared to NP (B) tumors based on both proteomics data and IHC results. IHC results (40 ×) are from a matched sample pair. The image was taken from the most markedly stained sections of each slide. (C) depicts the log2 abundance values of DSP in the proteomics dataset. (D) Depicts the staining without the primary antibody. (E) Depicts the staining without the secondary antibody.

