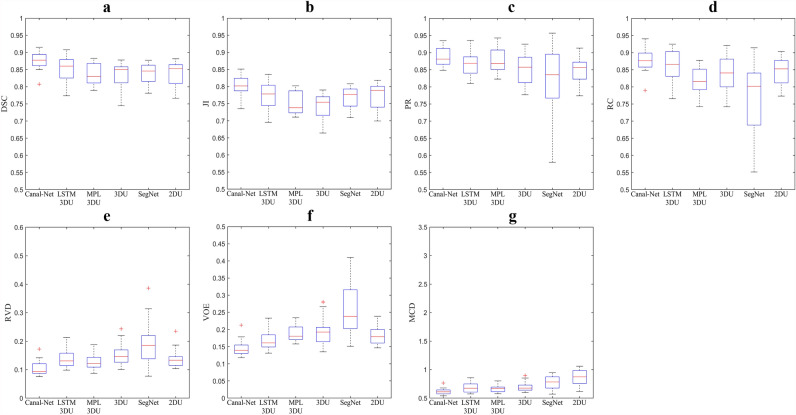
Figure 2.
The boxplots of segmentation performance results of the (a) Dice similarity coefficient score (DSC), (b) Jaccard index (JI), (c) precision (PR), (d) recall (RC), (e) relative volume difference (RVD), (f) volume of error (VOE), and (g) mean curve distance (MCD) for the deep learning networks, Canal-Net, ConvLTSM 3D U-Net (LSTM 3DU), MPL 3D U-Net (MPL 3DU), 3D U-Net (3DU), SegNet, and 2D U-Net (2DU). Each box contains the first and third quartile of data. The medians are located inside of the boxes, visualized as red lines. The whiskers are extended above and below each box in ± 1.5 times the interquartile range (IQR), and the outliers are visualized as red + marks defining values 1.5 IQR away from the box.

