FIGURE 1.

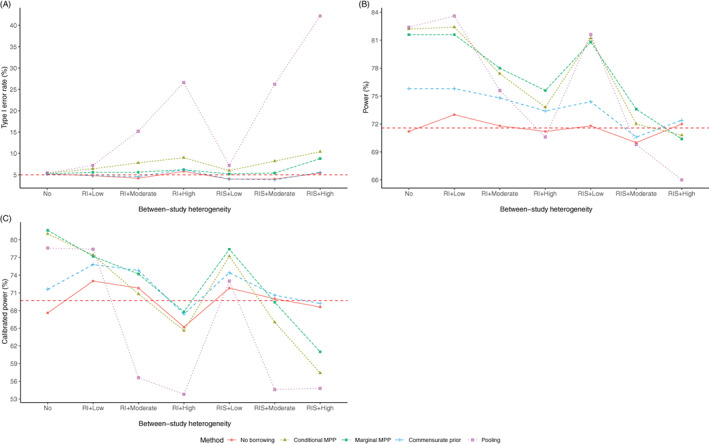
The type I error rate (A), statistical power (B), and calibrated power (C) of the estimated treatment effect for different methods based on 500 simulated data sets

The type I error rate (A), statistical power (B), and calibrated power (C) of the estimated treatment effect for different methods based on 500 simulated data sets