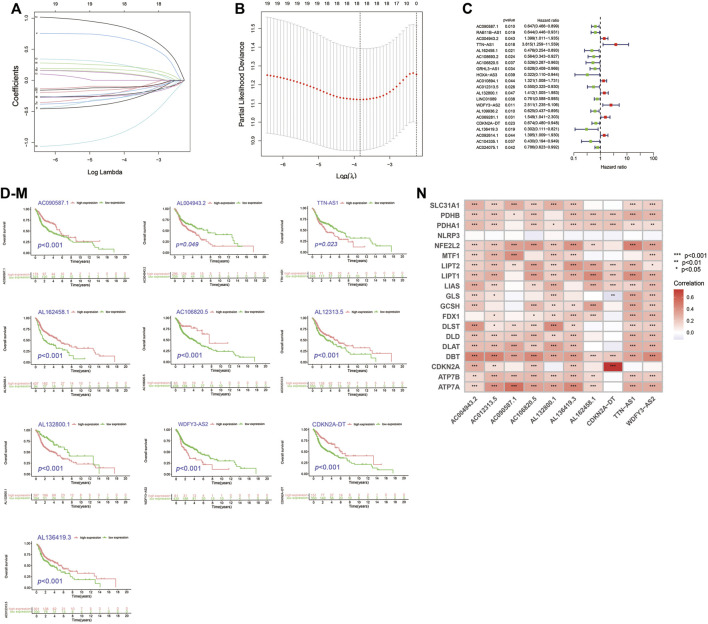
FIGURE 2.
Construction of Cupr-RLs prognostic signature in HNSC. (A) The least absolute shrinkage and selection operator (LASSO) Cox regression analysis. (B) Lasso coefficient values and vertical dashed lines were calculated at the best log (lambda) value. (C) Univariate Cox regression analysis supported the remarkable prognostic significance of the Cupr-RLs. (D–M) K–M curves showed different OS with different expression levels of the 10 Cupr-RLs. (N) Corrplot displayed the relationship between the 10 Cupr-RLs with 19 cuproptosis-related genes. *p < 0.05, **p < 0.01, ***p < 0.001.

