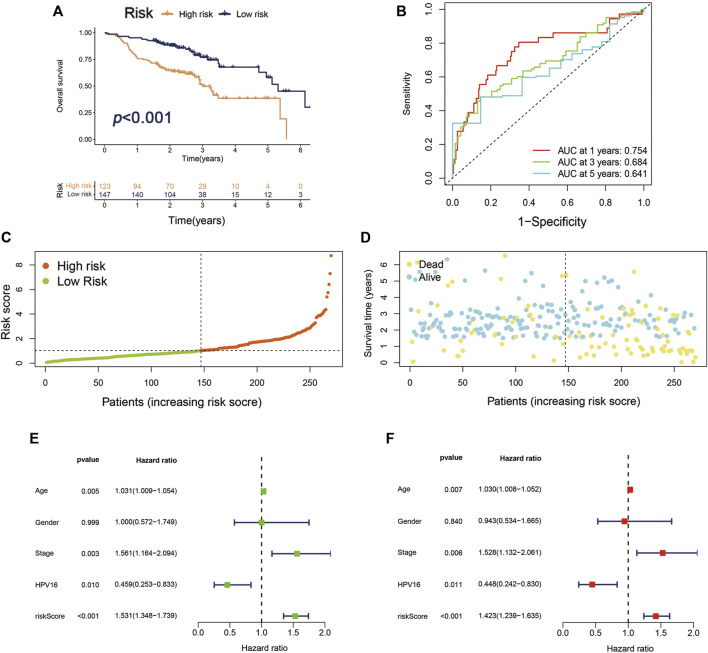
FIGURE 5.
Validation of Cupr-RLPS of GSE65858 cohort. (A) K–M curves showed the significant different OS outcomes between the high-risk and low-risk groups. (B) AUC values showed 1, 3, and 5 years’ predictions in the cohort. (C) The risk score distribution plot displayed the patients’ distribution in high risk and low risk in the cohort. (D) The Scatter plot manifested the relationship between the survival status and the risk scores in high-risk and low-risk groups. (E) Univariate and (F) multivariate Cox regression analysis further indicated that the signature was an independent factor.

