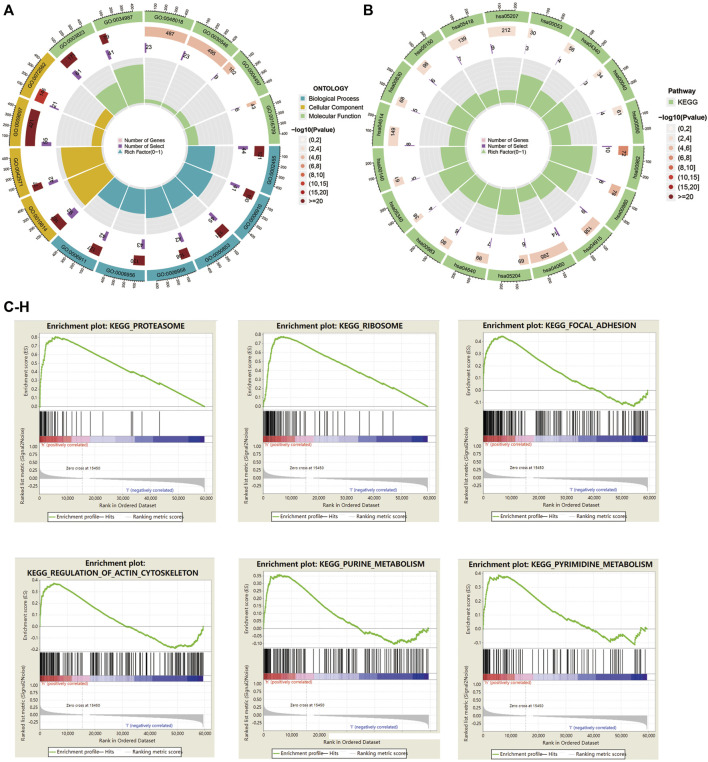
FIGURE 7.
GO, KEGG enrichment, and GSEA analysis in HNSC patients based on the prognostic signature. (A) The circle graph showed top GO signaling pathways involved BP, MF, and CC biological processes. (B) The circle graph showed top KEGG signaling pathways. (C–H) GSEA analysis showed top pathways enriched in the high-risk group.

