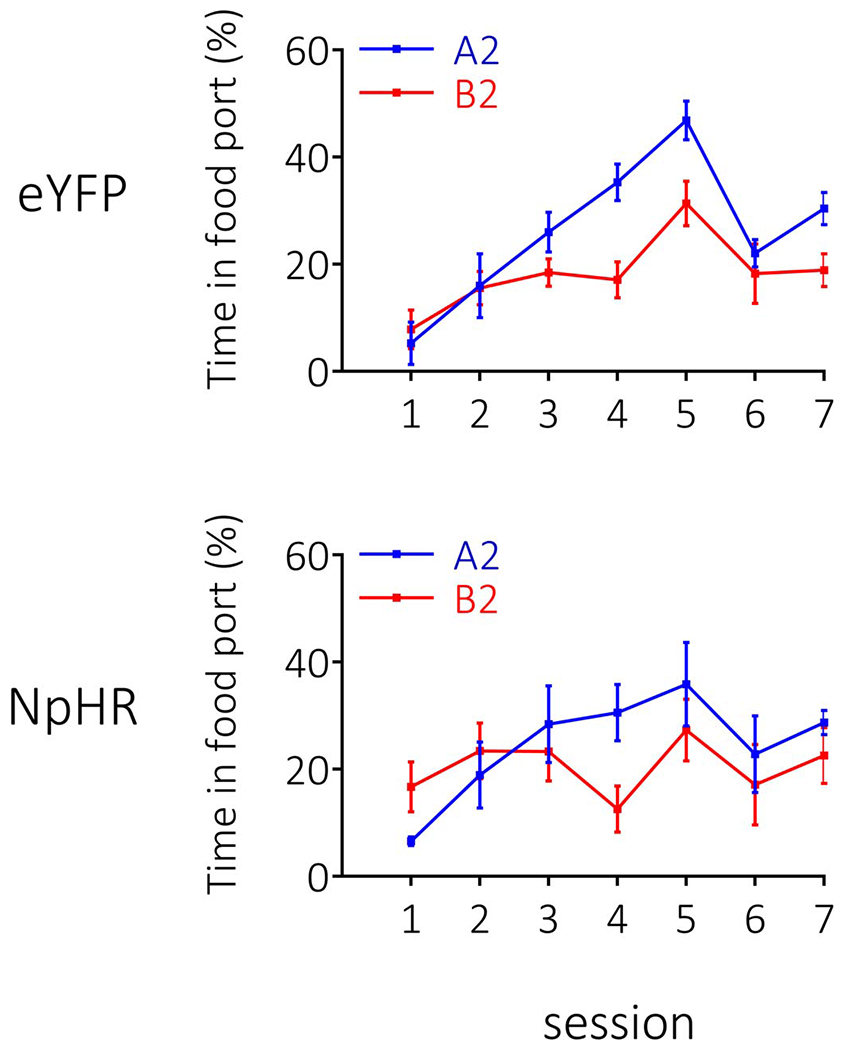
Extended Data Fig. 3. Extended data 3. Responding during conditioning in the second-order conditioning experiment (see Figure 4 main text).

Rates of responding are represented as time spent in the food port (%; ±SEM). Rats (n=12 eYFP; n=8 NpHR) learnt to distinguish between A2 and B2 during conditioning, with no difference in the rates of learning between groups (note: patch cords were placed on rats in session 6 of conditioning to habituate them to the cords prior to pairings of A1→A2 and B1→B2, which is why there is a dip in responding). A repeated-measures ANOVA revealed a main effect of stimulus (F1,18=12.383, p=0.002) and session (session: F6,108=10.799, p=0.424), with no interactions by group (stimulus x group: F1,18=1.151, p=0.298; session x group: F6,108=1.008, p=0.424; stimulus x session: F6,108=5.440, p=0.000; stimulus x session x group: F6,108=0.233, p=0.965).
