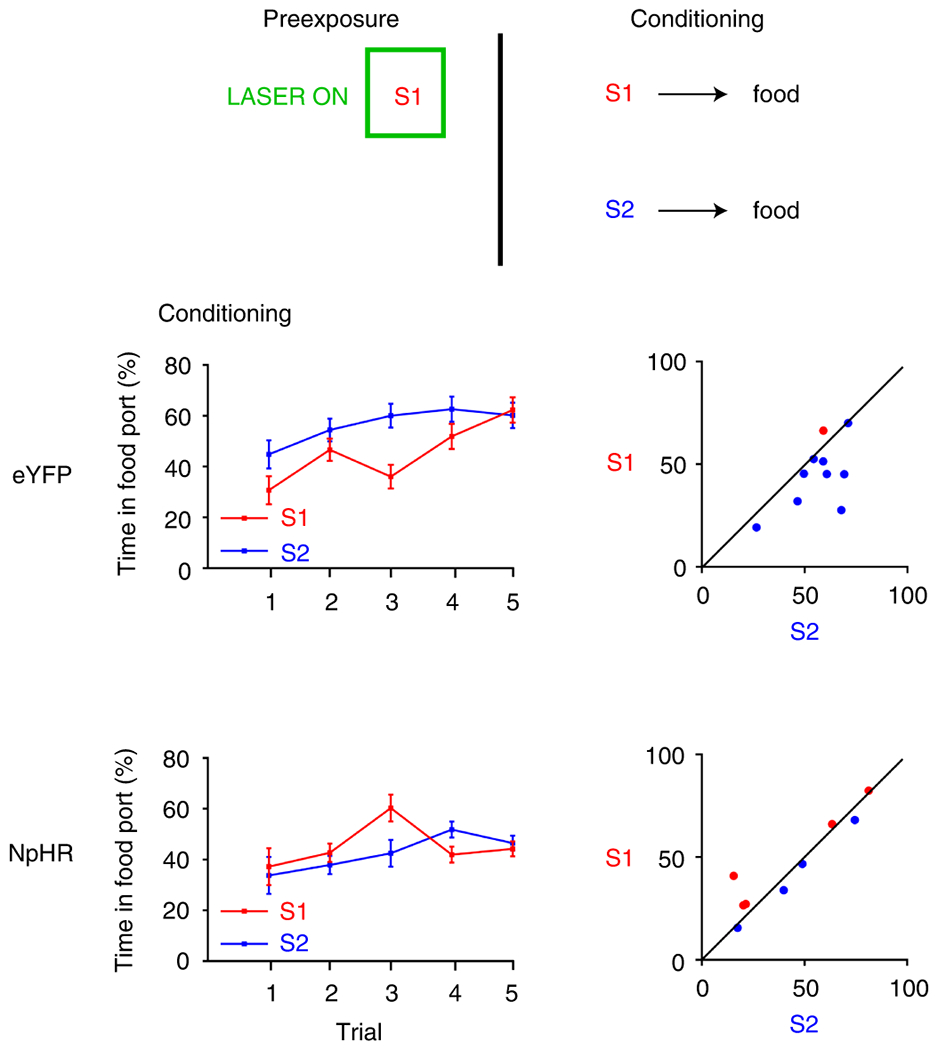
Figure 7. LH GABAergic neurons are necessary for the downregulation of processing of explicitly irrelevant cues.

Responding is represented as the time spent in the food port (%; ±SEM) during stimulus presentation when S1 and S2 were paired with food reward. Plots to the left indicate group means by trial, while plots on the right show individual rats’ responses. To the extent that responding to the cues is equivalent, points should congregate on the diagonal. Rats first received pre-exposure to S1. Here, we optogenetically inhibited LH GABA neurons during S1 in our NpHR group (n=9 rats). Then, rats received S1 and S2 paired individually with food. During this session, our control group (eYFP; n=10 rats), showed slower learning about S1 relative to novel S2 (top), demonstrating that our control group downregulated processing of S1 during pre-exposure. However, rats in our NpHR group did not show this effect, demonstrating equivalent rates of learning about S1 and S2 across conditioning (bottom). This shows that LH GABA neurons are necessary to downregulate processing of the irrelevant S1, consistent with the idea that LH GABA neurons usually oppose learning and processing of information that does not predict something motivationally significant. This was confirmed with statistical analyses. A repeated-measures ANOVA showed no main effect of cue (F1,17=2.246, p=0.152), but a significant interaction between cue and group (F1,17=6.333, p=0.022), due to a significant difference between responding for S1 and S2 in the eYFP group (F1,17=8.508, p=0.010) that was not present in the NpHR group (F1,17=0.492, p=0.492). There was no significant between-group difference in responding to S1 (F1,17=0.001, p=0.980), or S2 (F1,17=2.263, p=0.151). Finally, there was no between-group difference in overall levels of responding during the cues (F1,17=0.667, p=0.425). Data were analyzed with a repeated-measures ANOVA, with simple-main effects following a significant interaction, not necessitating control for multiple comparisons.
