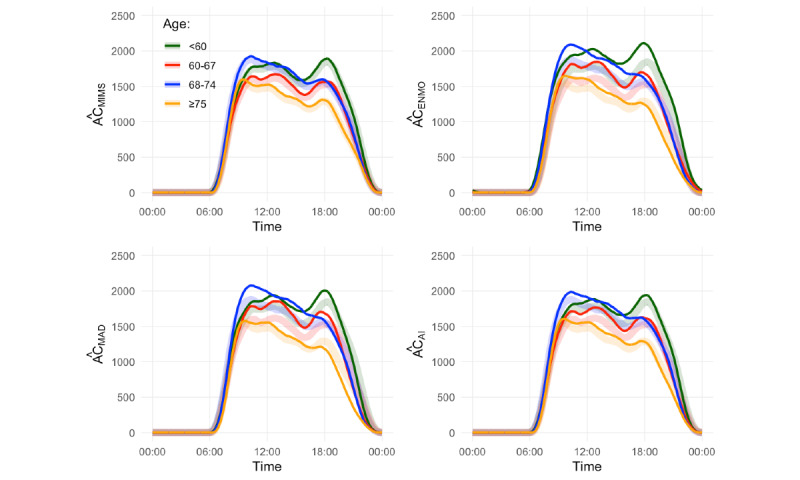
Figure 2.

Smoothed 24-hour median activity counts per minute for each age group: <60 years (green), 60-67 years (red), 68-74 years (blue), and ≥75 years (orange). Semitransparent thick colored lines represent results obtained with activity count; they are the same for all 4 plots. Solid thin colored lines represent results obtained with values mapped into activity count from monitor-independent movement summary, Euclidean norm minus one, mean amplitude deviation, or activity intensity. AC: activity count; AI: activity intensity; ENMO: Euclidean norm minus one; MAD: mean amplitude deviation; MIMS: monitor-independent movement summary.
