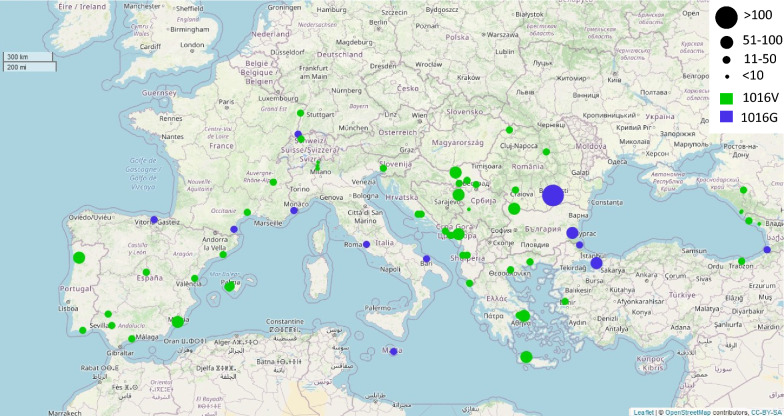
Fig. 1.
Distribution of the V1016V knockdown locus (kdr) in the gene encoding the voltage-sensitive sodium channel (vssc) in Aedes albopictus across Europe. Each dot represents a sampling site, while the size corresponds to the number of specimens that were PCR-genotyped for the V1016V kdr locus from that site. Details on the sampling sites and the 1016G allele frequencies per site are given in Additional file 1: Table S1. Green dots represent samples with wild-type 1016V allele only; blue dots represent samples where the kdr 1016G allele was detected. The georeferenced map was produced using the leaflet package (https://rstudio.github.io/leaflet/) in RStudio 4.1.2 with map data from OpenStreetMap contributor

