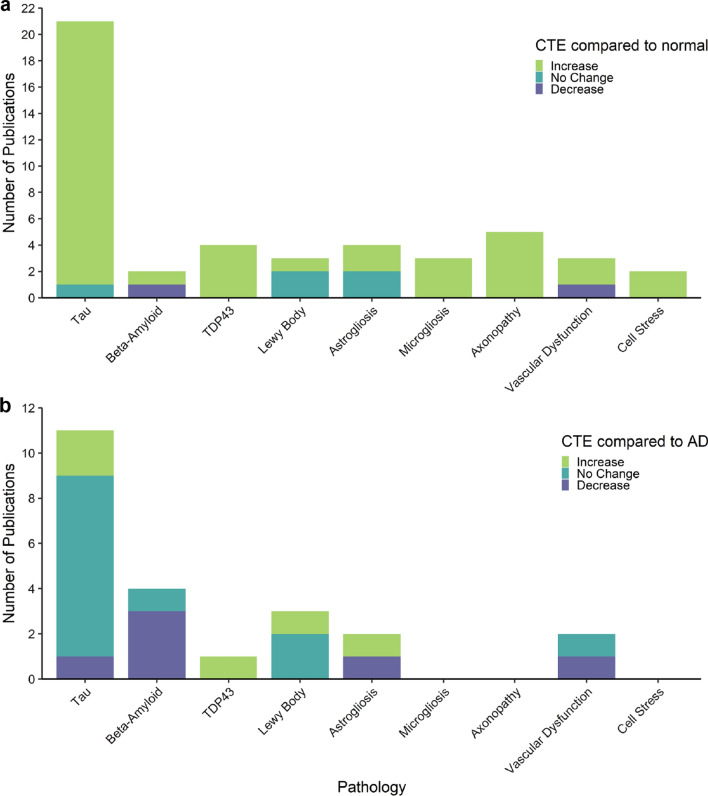
Fig. 3.
Summary of pathology findings in CTE postmortem tissue neuropathology studies. Stacked bar charts illustrating the number of human postmortem tissue publications that describe an increase, no change or decrease in CTE cases compared to neuropathologically normal cases (a) and Alzheimer’s disease cases (b) for each pathology category. Only studies where the amount of the pathology was compared between groups have been included in these graphs. Studies that describe differences in distribution were not included. Note that studies in each pathology category investigated different brain regions

