Fig. 3.
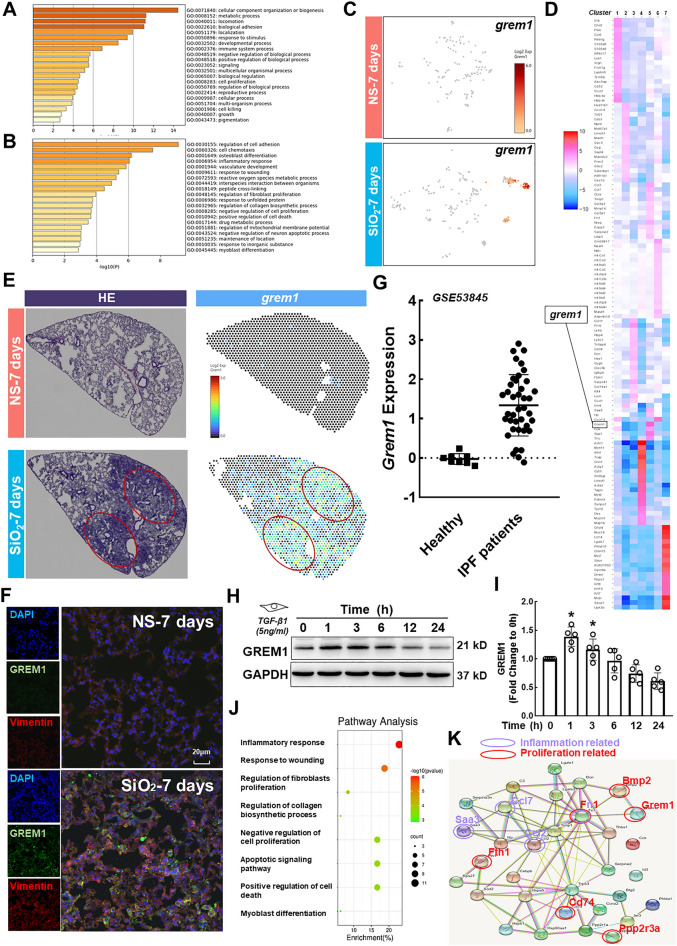
Results of biochemical analyses and validation of the scRNA-Seq analysis of inflammatory-proliferative fibroblasts. A GO enrichment analysis of the molecular functions of the top 50 genes in inflammatory-proliferative fibroblasts. B GO enrichment analysis of signaling pathways related to the top 50 genes in inflammatory-proliferative fibroblasts. C Expression of grem1 in seven subtypes. D Gene heatmap of the seven subtypes. E The spatial transcriptomic sequencing results show that grem1 is expressed at high levels in the lesion area. F Immunohistochemical staining showing that GREM1 is expressed on fibroblasts. The expression level of the experimental group was higher than that of the control group; the scale bar represents 20 μm. G In the GEO database, the expression of Grem1 in the lung tissue of patients with IPF was significantly higher than that found in the healthy group (*p < 0.05). H, I In HPF-a cells, GREM1 expression first increased and then decreased over time, and the expression levels at 1 and 3 h were significantly different from those at 0 h (*p < 0.05). J The bubble chart shows the pathways of interest among the related pathways identified in inflammatory-proliferative fibroblasts. K Interaction map between proteins enriched in signaling pathways examined in this study

