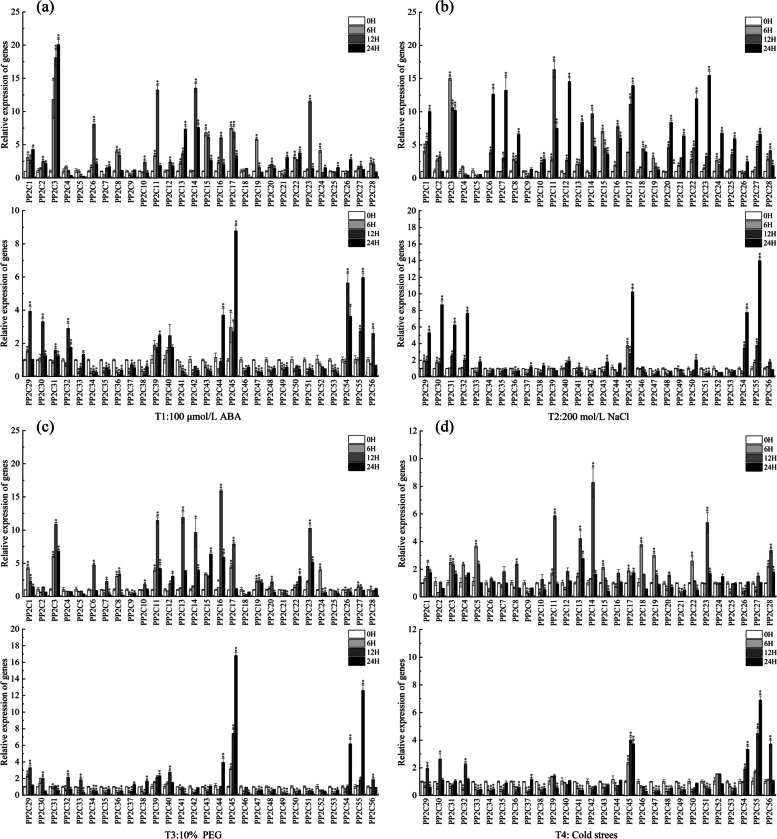
Fig. 7.
Quantitative real-time PCR analysis of CsPP2C genes in response to ABA (a), NaCl (b), PEG (c), cold treatments (d). he gene relative expression was calculated using the 2-∆∆Ct method with CsActin as an internal control, and value represents mean ± SE of three biological replicates. Statistical analyses were carried out by student’s t-test to determine the differences in gene abundances between 0 h and other treatment times. Asterisks indicated values that are significantly different from CK (0 h) (* p < 0.05, ** p < 0.01, one-way ANOVA)

