
Figure 2.
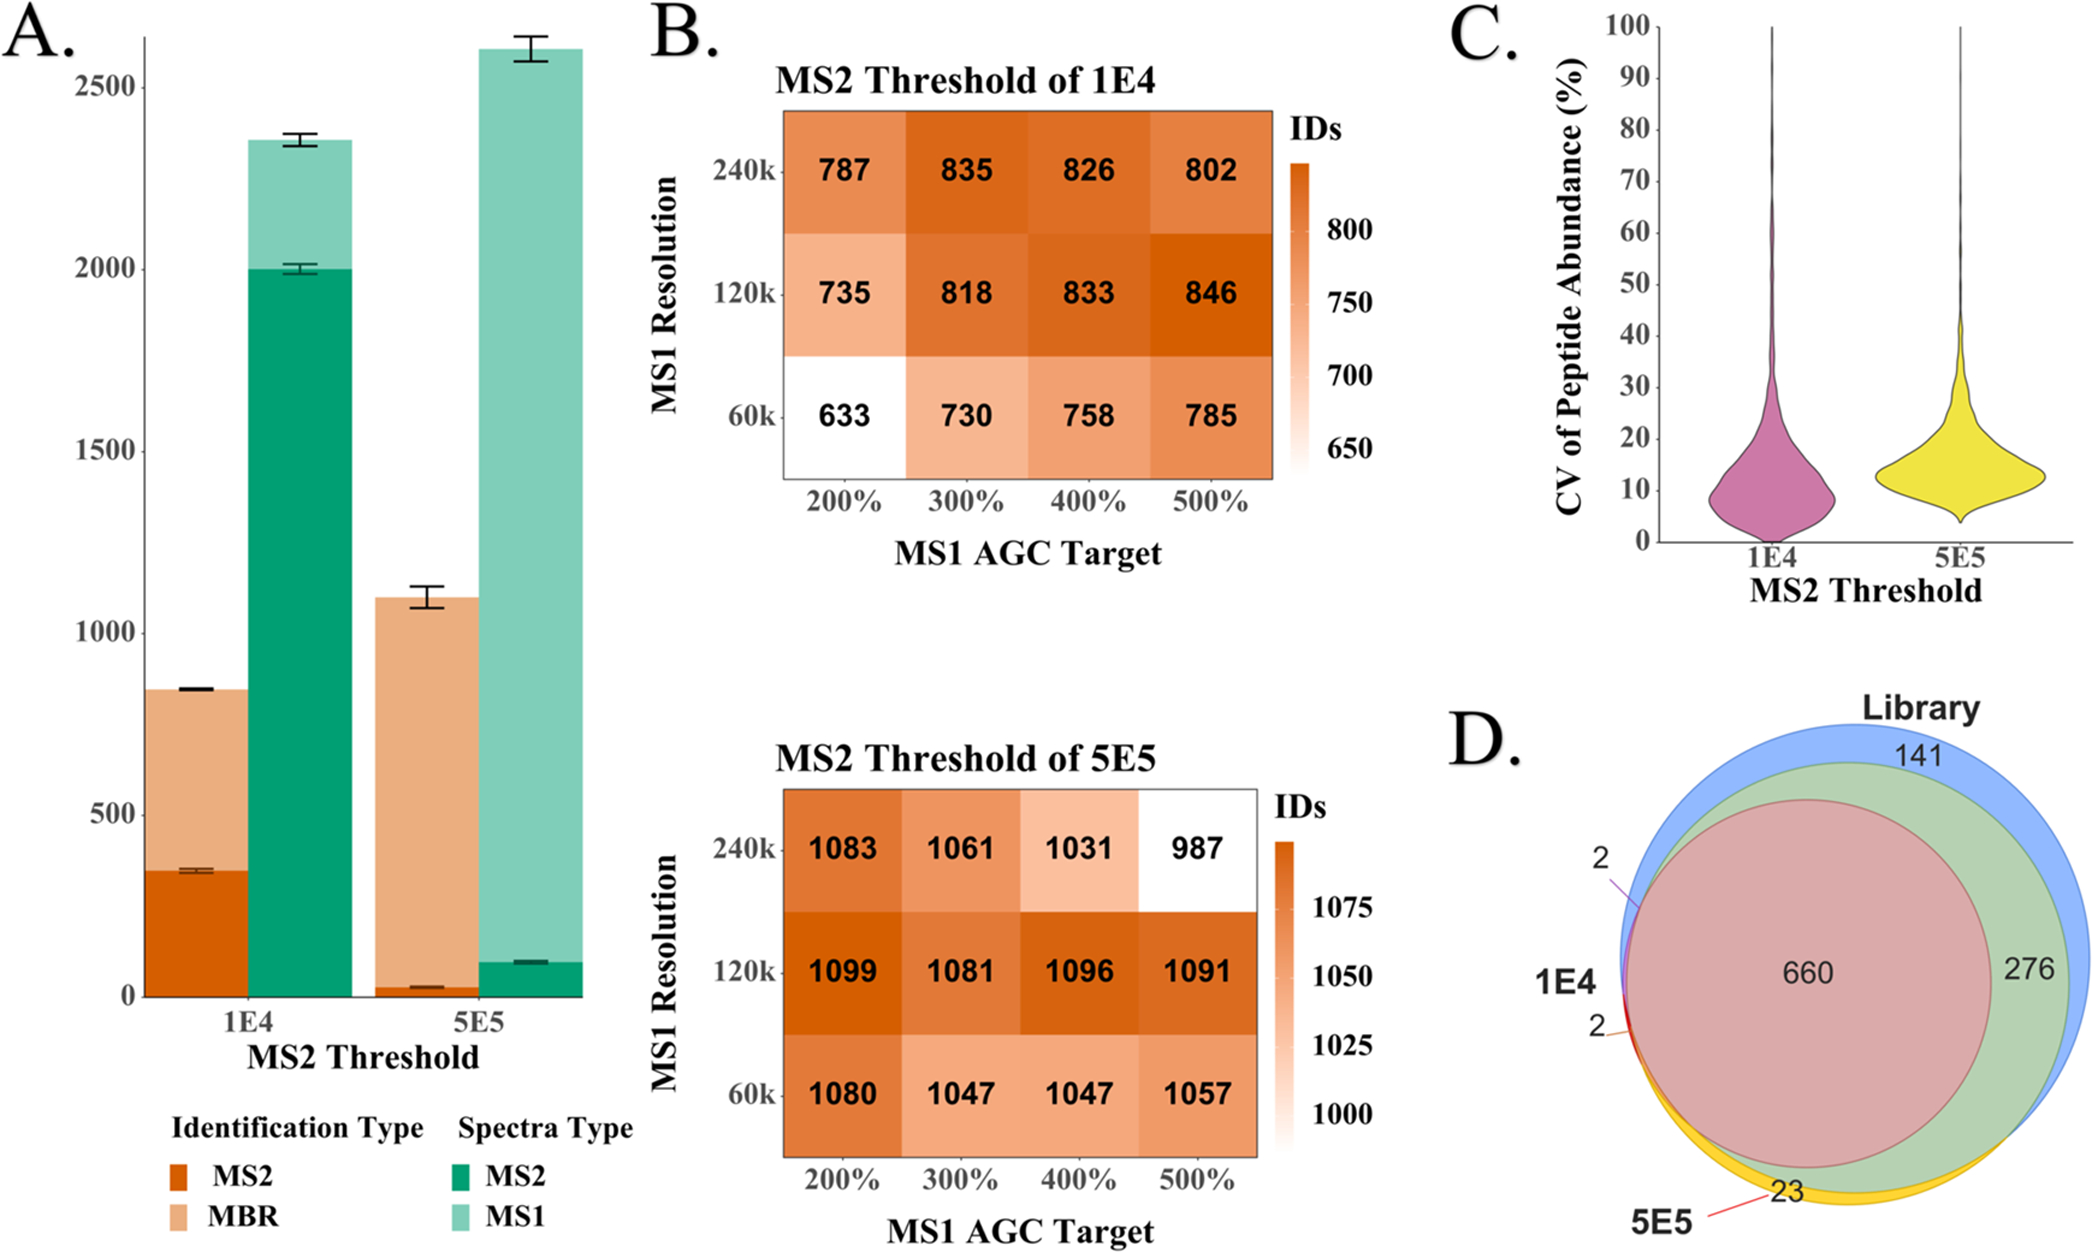
Optimization of acquisition settings using 200 pg aliquots of HeLa digest. (A) Relationship between the number of MS2 spectra acquired and the number of high-confidence protein groups identified. (B) Three-dimensional (3D) matrix of mass spectrometer settings and combined MBR and MS2 identifications. The shading indicates the number of proteins identified on average per run. The conditions with the highest number of identifications for each threshold were used to determine the (C) coefficients of variation (CVs) of the log 2-transformed peptide abundances and (D) Venn diagrams of the overlapping protein identifications.