Figure 8.

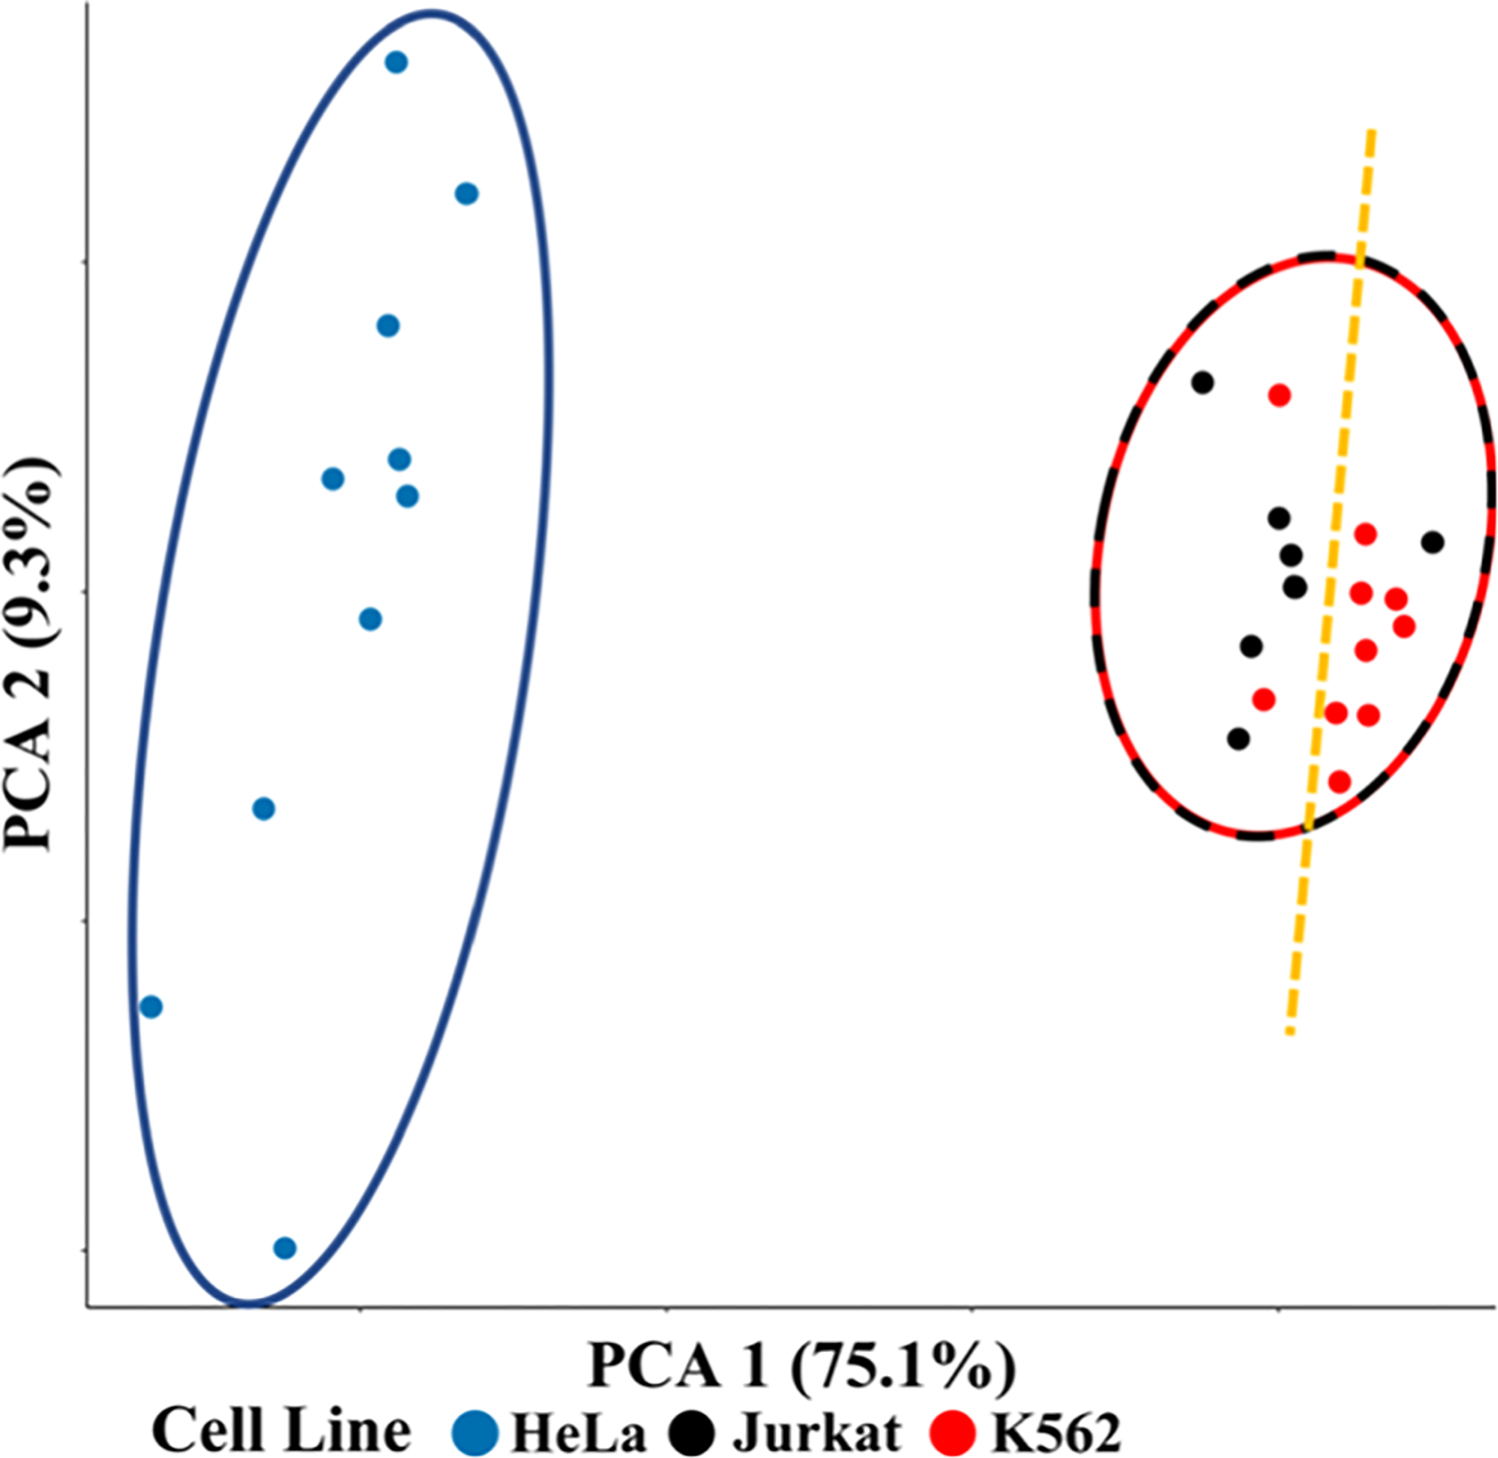
PCA plot for protein expression in single HeLa, Jurkat, and K562 cells. The blue circle is the HeLa cluster, the red/black dashed circle is the leukemia cluster, and the yellow line separates Jurkat and K562 cell lines.

PCA plot for protein expression in single HeLa, Jurkat, and K562 cells. The blue circle is the HeLa cluster, the red/black dashed circle is the leukemia cluster, and the yellow line separates Jurkat and K562 cell lines.