Fig. 4.
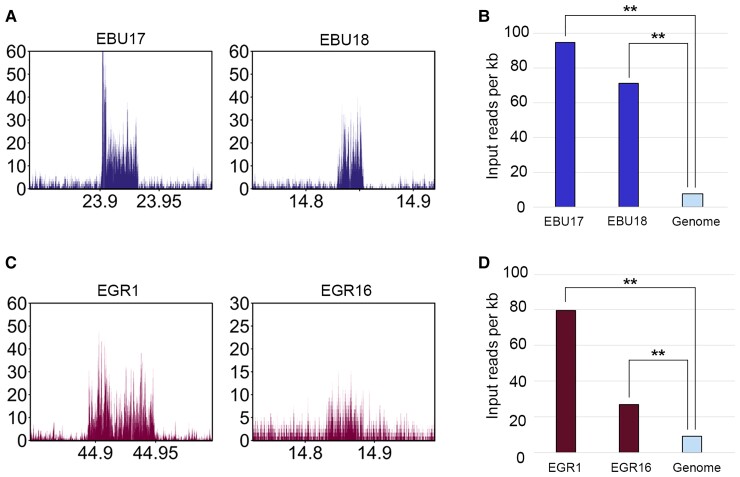
DNA sequence amplification at Burchell’s zebra and Grevy’s zebra satellite-free centromeres. (A) Profiles of input (not immunoprecipitated) reads from Burchell’s zebra at EBU17 and EBU18 centromeric regions. The y-axis reports the RPKM count, whereas the x-axis reports the coordinates on the reference genome. (B) Input read counts per kilobase (y-axis) are shown for EBU17 and EBU18 satellite-free centromeres and for the whole genome (Equus_quagga_cen). The double asterisks indicate statistically significant differences, with a P-value of <0.01. (C) Profile of input reads from Grevy’s zebra at EGR1 and EGR16 centromeres. The y-axis reports the RPKM count, whereas the x-axis reports the coordinates on the reference genome. (D) Input read counts per kilobase (y-axis) are shown for EGR1 and EGR16 satellite-free centromeres and the whole genome (EGR_EBU_cen). The double asterisks indicate statistically significant differences, with a P-value of <0.01.

