
Figure 1.
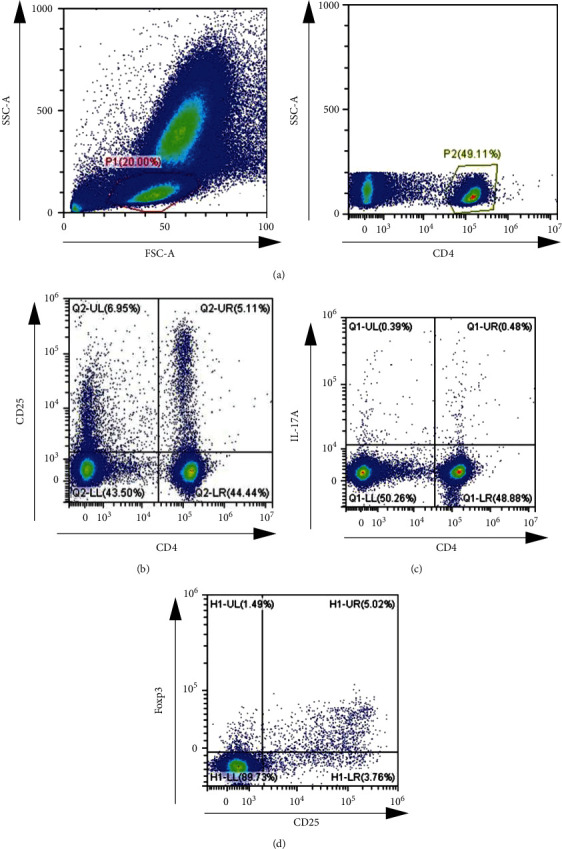
Proportions of peripheral T cells in mouse blood sample ((a) the gating strategy for CD4+ cells in mouse blood sample, (b) representative flow cytometric dot plots of CD4+CD25+ T cells, (c) Representative flow cytometric data of CD4+IL-17A+ T cells, and (d) representative flow cytometric data of CD4 + CD25+Foxp3+ T cells).