. 2022 Apr 12;20(8):1284–1294. doi: 10.1158/1541-7786.MCR-21-0905

Figure. 3.

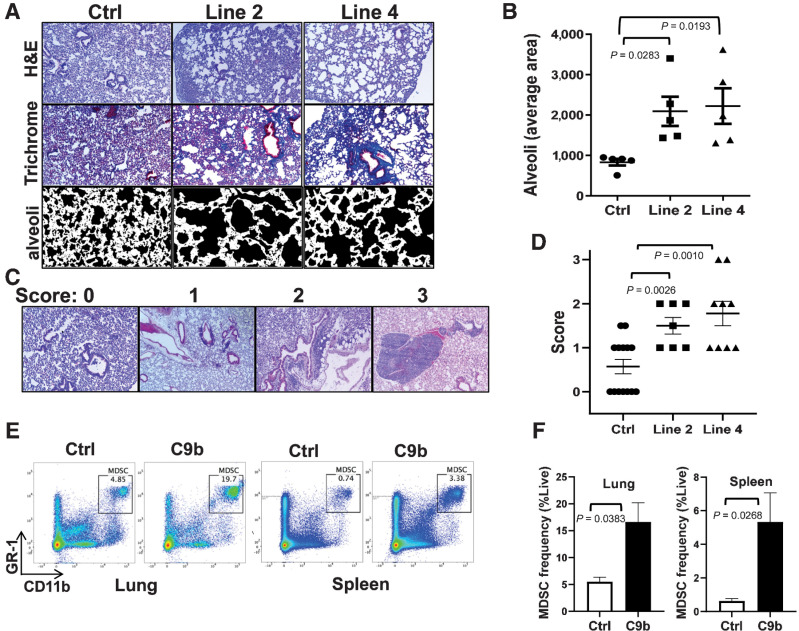
Figure. 3. Lungs of C9b mice show emphysema, fibrosis, and immune infiltration. A, H&E and trichrome staining show enlarged alveoli and increased peribronchovascular collagen deposits in line 2 and line 4 mice compared with control. Average area of alveoli (B, n = 5 per group) is measured using Image J from trichrome stained slides avoiding large vessels and bronchi (A, bottom). C and D, Scoring systems for immune aggregates and infiltrates (C, 10X) and average lung inflammation score for each group (n = 14 for control, 7 for line 2, and 9 for line 4 mice, D). E and F, Increased % of MDSCs (Gr1+/CD11b+) in lung and spleen of C9b mice (n = 3) compared with Control (n = 3) by FACS analysis. Data are means ± SEM. Adjusted P values are determined by ANOVA Tukey multiple comparison test for B and D and by unpaired t-test for F.

Lungs of C9b mice show emphysema, fibrosis, and immune infiltration. A, H&E and trichrome staining show enlarged alveoli and increased peribronchovascular collagen deposits in line 2 and line 4 mice compared with control. Average area of alveoli (B, n = 5 per group) is measured using Image J from trichrome stained slides avoiding large vessels and bronchi (A, bottom). C and D, Scoring systems for immune aggregates and infiltrates (C, 10X) and average lung inflammation score for each group (n = 14 for control, 7 for line 2, and 9 for line 4 mice, D). E and F, Increased % of MDSCs (Gr1+/CD11b+) in lung and spleen of C9b mice (n = 3) compared with Control (n = 3) by FACS analysis. Data are means ± SEM. Adjusted P values are determined by ANOVA Tukey multiple comparison test for B and D and by unpaired t-test for F.