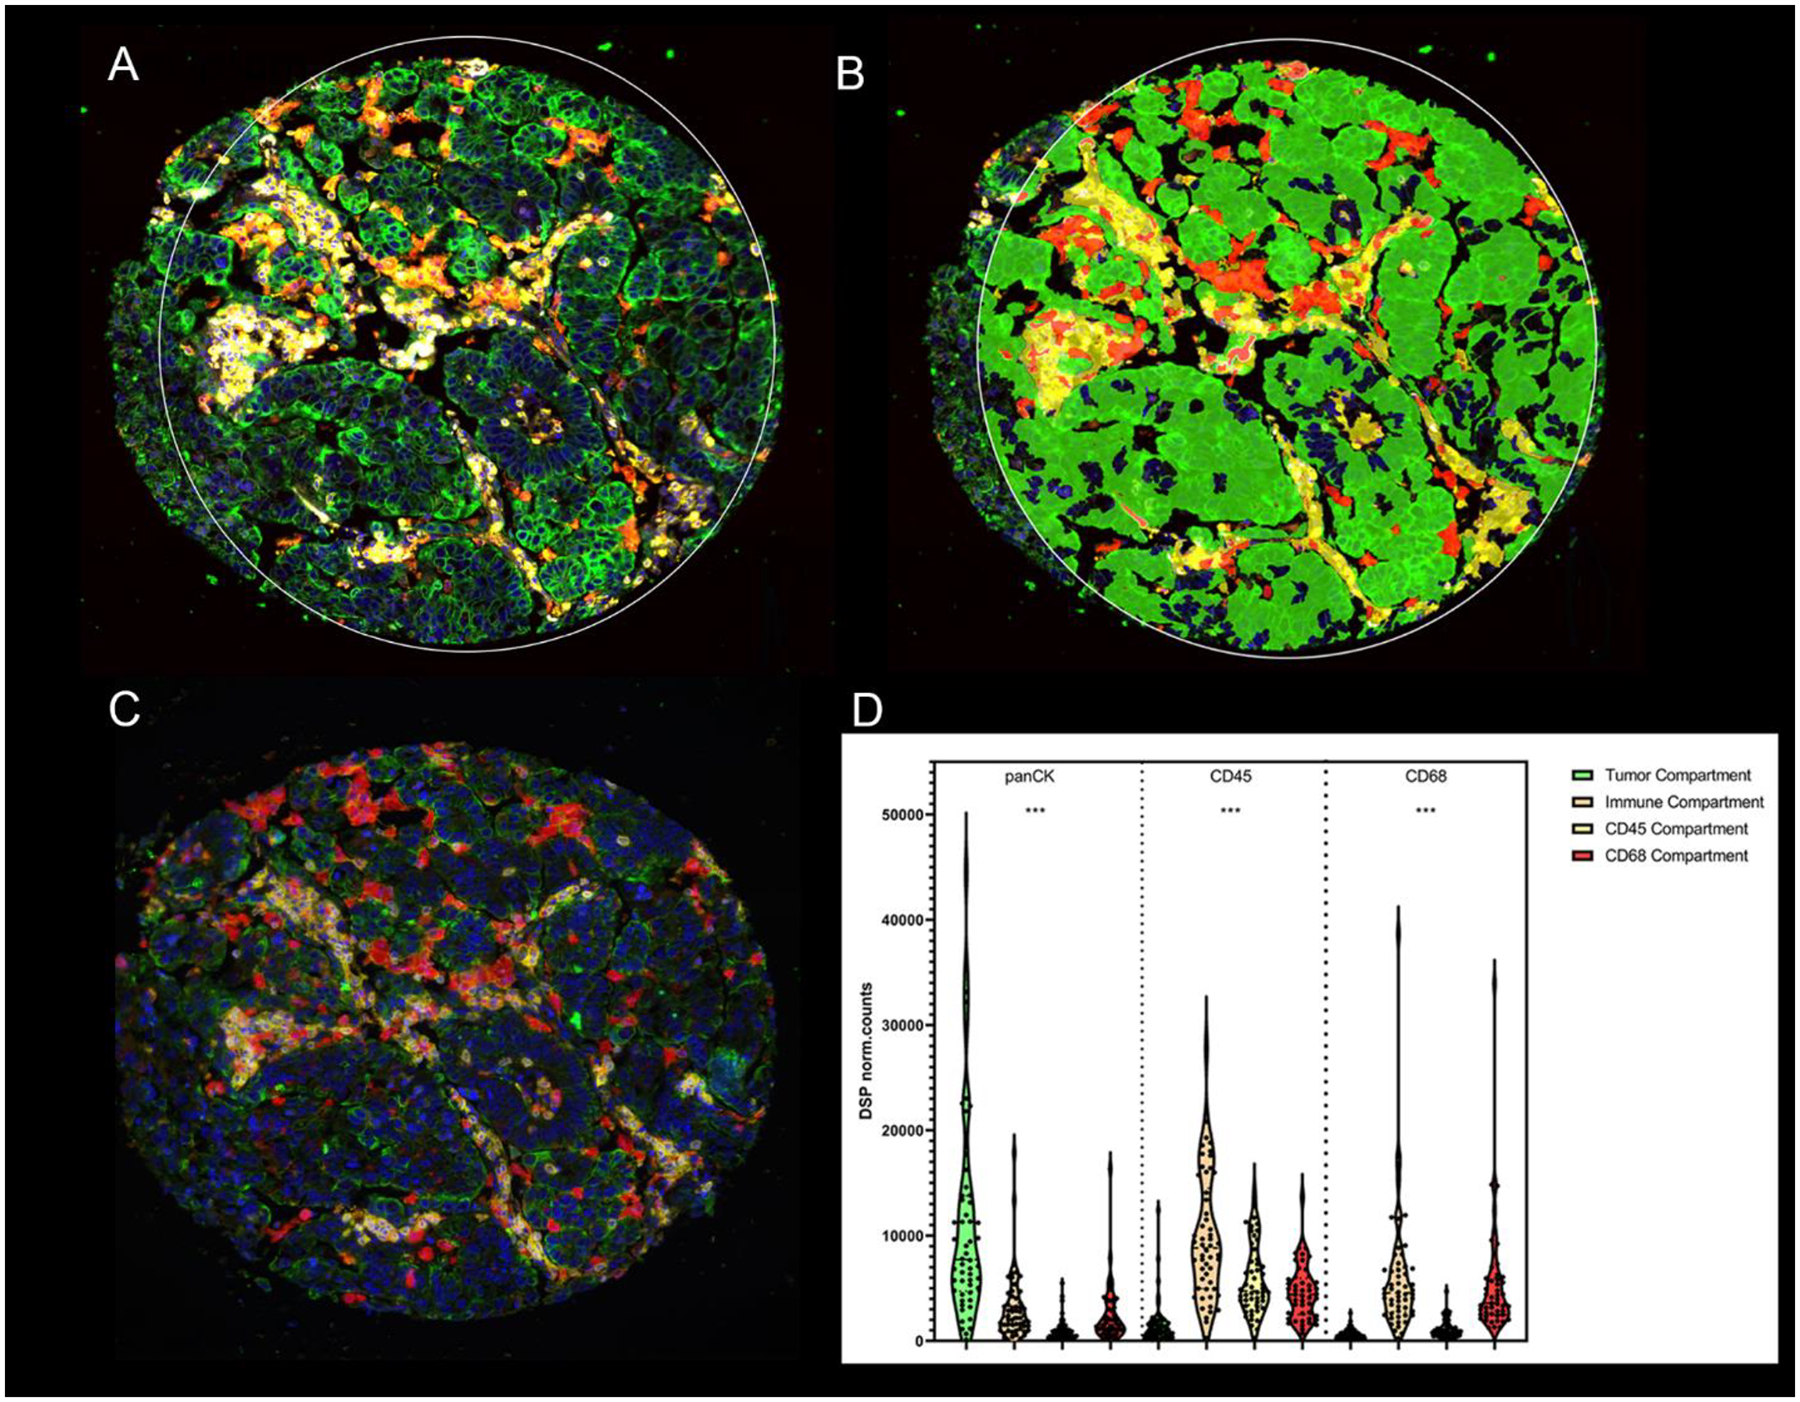
Figure 1.

Representative TMA spot showing the fluorescence image (A) and the compartmentalized image created by fluorescence colocalization (B) using GeoMx DSP; Cytokeratin (panCK) (green), CD45 (yellow), CD68 (red), SYTO13 (blue) and (C) using QIF; Cytokeratin (green), CD45 (yellow), CD68 (red), DAPI (blue); (D) Normalized DSP counts of panCK, CD45 and CD68 in the four molecular compartments (tumor, Immune stromal, CD45 and CD68). P-values legends ***:P<0.001, Yale tissue microarray, YTMA; quantitative immunofluorescence, QIF; digital spatial profiling, DSP
