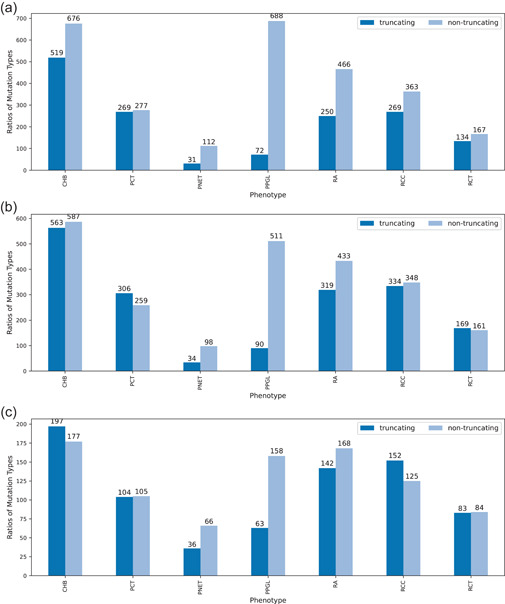
Figure 5.

Distribution of truncating and nontruncating variant by phenotype for (a) patient‐, (b) family‐, and (c) variant‐based data. Significant differences were seen between truncating/nontruncating distributions between phenotypes. In particular, nontruncating variants were favored over truncating variants for PPGL; results of PNETs distribution was also statistically different from all other phenotypes except RA, to favor nontruncating variants. PNET, pancreatic neuroendocrine tumor; PPGL, pheochromocytoma/paraganglioma; RA, retinal angioma.
