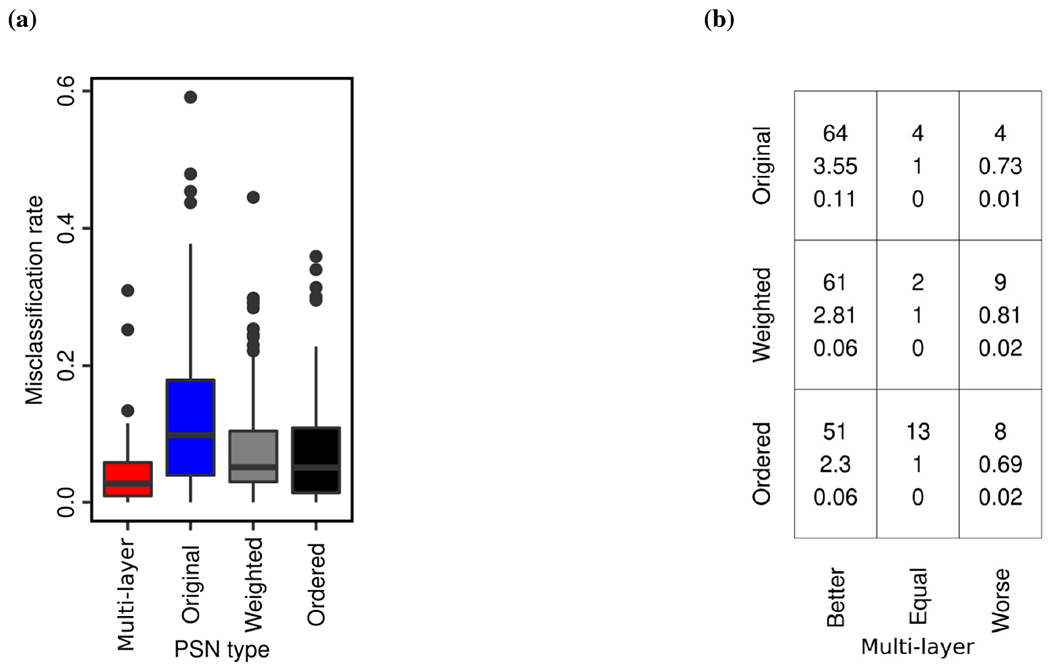
FIGURE 3.

Performance summary of the four PSN types over all 72 datasets. Panel (a) compares distributions of the 72 misclassification rates between the four PSN types. Panel (b) compares multi-layer PSNs (x-axis) with each of the original, weighted, and ordered PSNs (y-axis). In a given cell in panel (b), the three numbers mean the following. The top number indicates the number of datasets in which multi-layer PSNs perform better than, the same as, or worse than the corresponding original, weighted, or ordered PSNs. The middle number indicates the relative increase (if greater than 1) or decrease (if less than 1) in the performance of multi-layer PSNs compared to original, weighted, or ordered PSNs. The bottom number indicates the absolute increase or decrease in the performance of multi-layer PSNs compared to original, weighted, or ordered PSNs.
