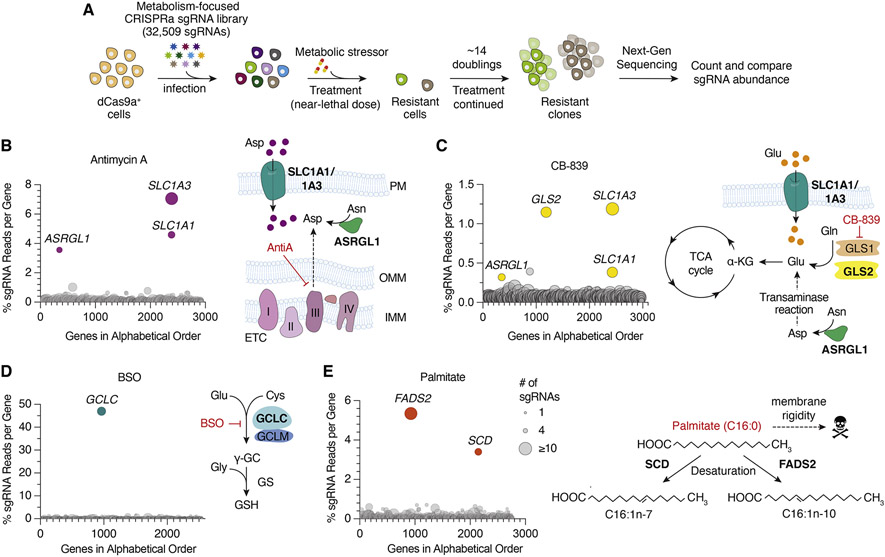
Figure 1. Metabolic-scale gene activation screens identify metabolic processes limiting for cell proliferation under stress conditions.
(A) Scheme describing metabolism-focused positive selection CRISPRa screens.
(B-E) CRISPRa screen results for (B) Antimycin A (10 nM), (C) CB-839 (6 μM), (D) BSO (2 mM) in Pa-Tu 8988t dCas9a cells and (E) Palmitate (200 μM) in Jurkat dCas9a cells. Data were plotted as genes in alphabetical order vs. percentage of sgRNAs reads per gene. Percent total sgRNA reads was calculated by summing up all sgRNA reads mapped to a gene and calculating the percentage of this sum to the number of sgRNA reads acquired from the entire population. Bubble size indicates number of detected sgRNAs post-screen.

