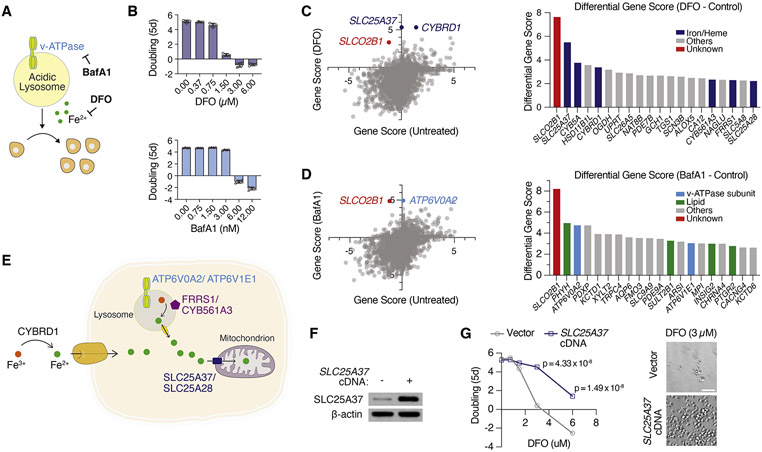
Figure 2. CRISPRa screens reveal metabolic genes conferring resistance to iron depletion.
(A) BafA1 and DFO decreases cellular iron availability through different mechanisms.
(B) Dose-dependent effects of DFO and BafA1 on proliferation of Jurkat cells (Mean ± SEM, n = 5).
(C) Gene scores of untreated vs. DFO (2 μM)-treated Jurkat-dCas9a cells (left). Gene score is the median log2 fold change in the abundance of all sgRNAs targeting that gene during the screening period. Differential gene scores of top 20 genes providing resistance to DFO (right). Iron/heme-related genes are indicated in dark blue.
(D) Gene scores of untreated vs. BafA1 (5 nM)-treated Jurkat-dCas9a cells (left). Differential gene scores of top 20 genes providing resistance to BafA1 (right). Vacuolar ATPase subunits are indicated in light blue, lipid metabolism-related genes in green, other genes in gray.
(E) Scheme displaying selected scoring genes conferring resistance to iron-restriction.
(F) Immunoblot analysis of control and SLC25A37-overexpressing Jurkat cells. β-actin was used as loading control.
(G) Fold change in the number (log2) of control vector and SLC25A37-overexpressing cells after 5 days in the presence of indicated DFO concentrations (left). Representative bright-field micrographs of Jurkat cells after 5-day treatment with 3 μM DFO (right). Scale bar is 50 μM.
See also Figures S1-S3, Tables S9-S14

