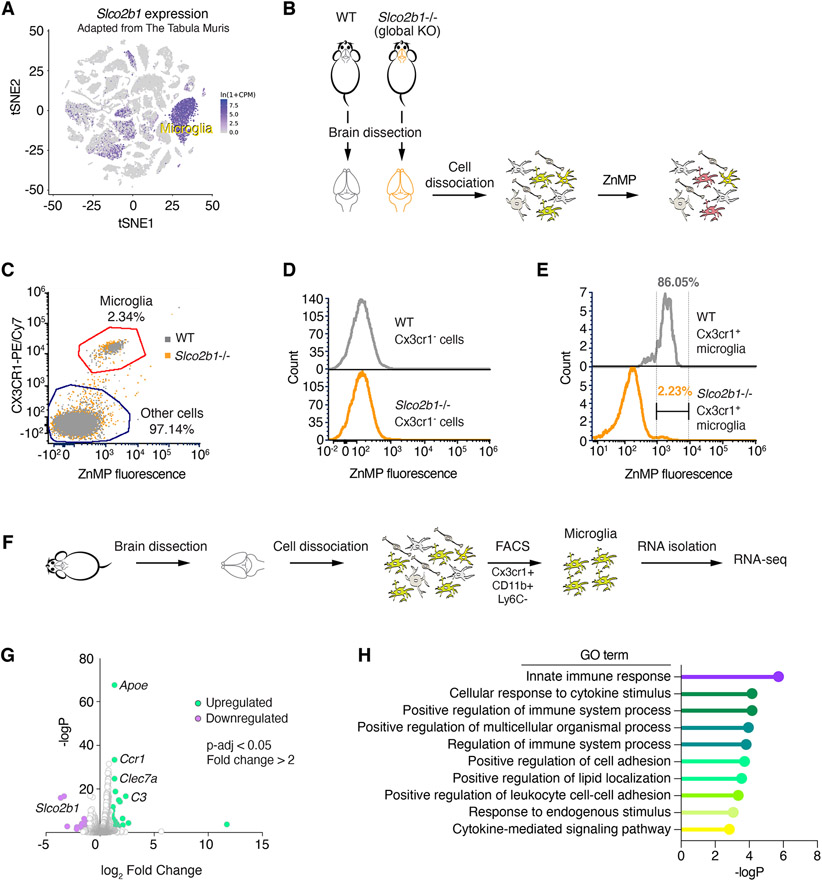
Figure 6. Slco2b1 is necessary for heme analog uptake in microglial cells.
(A) t-SNE plot for Slco2b1 expression across single cell transcriptome of mouse cell types. Adapted from Tabula Muris.
(B) Experimental strategy for the ZnMP uptake assay of primary cells derived from brains of wild type and Slco2b1 knockout mice.
(C) Flow cytometry analysis of ZnMP fluorescence and Cx3cr1-labeling (microglia marker) in cells isolated from wild-type and Slco2b1 knockout mouse brains.
(D) Flow cytometry analysis of ZnMP fluorescence in Cx3cr1− non-microglial cells.
(E) Flow cytometry analysis of ZnMP fluorescence in Cx3cr1+ microglia.
(F) Experimental strategy for sorting mouse microglia by FACS for RNA-seq.
(G) Volcano plot for differential gene expression analysis between WT and Slco2b1−/− mouse microglia. p-value adjusted <0.05. Upregulated genes (fold change > 2) are shown in green, downregulated (fold change < −2) in purple. See also Table S3.
(H) Gene ontology enrichment analysis for significantly upregulated genes. p < 0.05, hypergeometric test.
See also Figure 5

