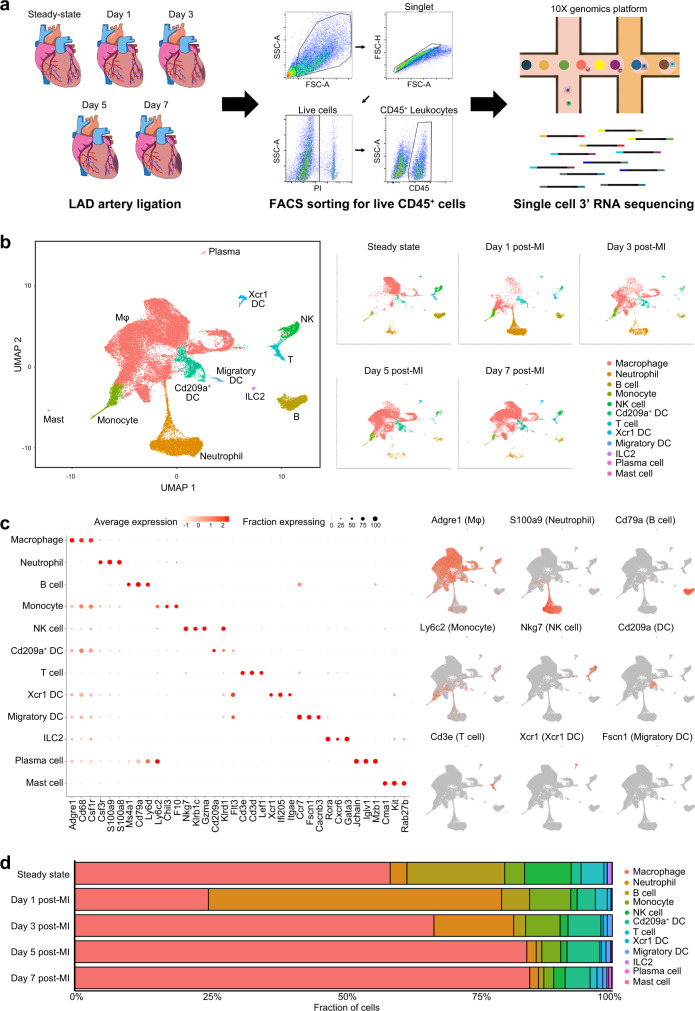
Fig. 1. Time-dependent immune cell dynamics after myocardial infarction.
a Graphical representation of the experimental setup. Experimental MI was induced in mice by the permanent ligation of the proximal portion of the left anterior descending artery (LAD). Samples were isolated from mouse hearts at days 0, 1, 3, 5, and 7 post-MI. Tissues were enzymatically digested and live CD45+ cells were FACS-sorted and loaded for scRNA-seq. b Two-dimensional uniform manifold approximation and projection (UMAP) visualization of the 33,977 cardiac CD45+ cells identified 12 broad cell types after unsupervised clustering. Each point represents a single cell; cell types are color-coded. c Left: dot plot of well-known cell-type-specific marker genes per cell type. The dot intensity (from white to red) represents the average expression value of all cells per cell type and the dot size represents the proportion of cells expressing the genes. Right: feature plot representing the expression levels of the selected cell-type-specific marker genes. d Bar plot representing the proportions of cells in each of the 12 broad cell types according to the time-point after MI. Source data are provided in the Source Data file.

