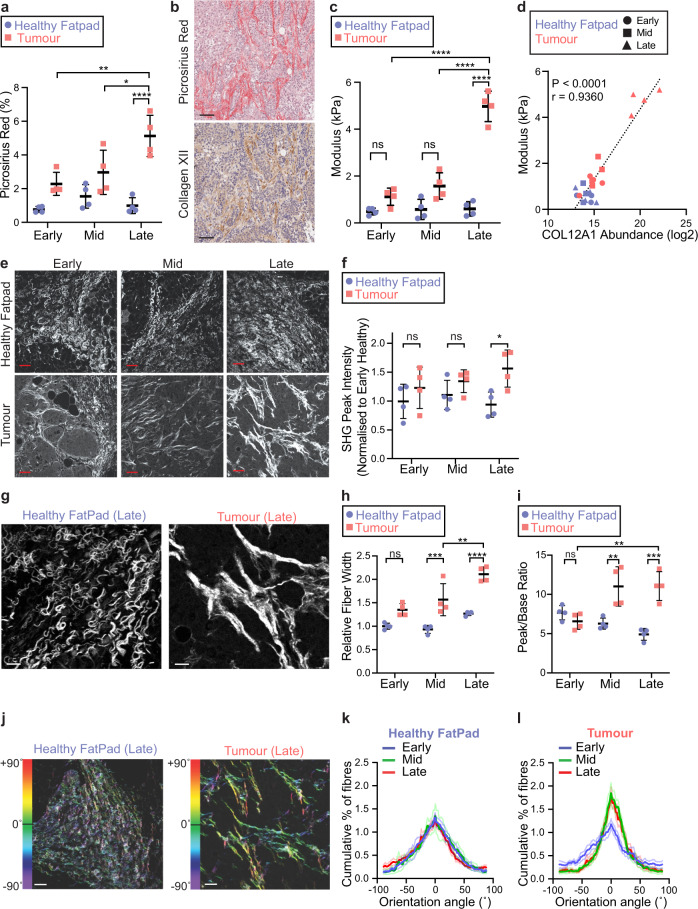
Fig. 3. Collagen XII abundance is associated with altered fibrillar collagen architecture and tumour stiffness.
a Quantification of total picrosirius red stained area in tumour and healthy fatpad tissues. n = 4 tissues; *p = 0.023, **p = 0.0022, ****p < 0.0001; two-way ANOVA with Tukey’s multiple comparison test. Mean ± SD presented. b Representative images of serial histological sections from n = 4 mammary tumour tissues stained for fibrillar collagen (picrosirius red), and collagen XII by IHC (scale bar = 50 µm). c Unconfined compression analysis of n = 4 tumours and healthy fatpads (mean ± SD, n = 4. ****p < 0.0001, ns = not statistically significant; early healthy vs. early tumour p = 0.37; mid healthy vs. mid tumour p = 0.051; two-way ANOVA with Tukey’s multiple comparison test. d Correlation between collagen XII protein abundance (LC-MS/MS) and bulk modulus of primary tissues (Pearson correlation test, r = 0.936, p < 0.0001; n = 24 tissues). e Representative single-plane images of second harmonic generation (SHG) signal acquired from n = 4 tumours and healthy fatpad tissues at early, mid and late stages (scale bar = 40 µm). f Quantification of peak SHG multi-photon signal. n = 4 tissues per group; *p = 0.017, ns = not statistically significant: early healthy vs. early tumour p = 0.58; mid healthy vs. mid tumour p = 0.57. Two-way ANOVA with Tukey’s multiple comparison test. g Representative single-plane images of SHG multi-photon images acquired from n = 4 late-stage tumours and healthy fatpad tissues (scale bar = 15 µm). h Quantification of collagen I fibre bundle width in images from g. Mean ± SD of n = 4 tissues per group; **p = 0.0032, ***p = 0.0006, ****p < 0.0001, ns: p = 0.083; two-way ANOVA with Tukey’s multiple comparison test. i Quantification of collagen I fibril orientation peak to baseline ratio. Mean ± SD, n = 4 tissues per group; **p < 0.01, ***p < 0.001, ns: p = 0.89; mid healthy vs. mid tumour p = 0.0025, late healthy vs. late tumour p = 0.0001, early tumour vs. late tumour p = 0.0042; two-way ANOVA with Tukey’s multiple comparison test. j Representative images of fibril-orientation analysis for collagen I fibres in n = 4 tissues (scale bar = 40 µm). Collagen I fibril orientation distribution for k staged healthy fatpad and l tumour (±SEM, n = 4) corresponding to analysis in i. Source data are provided in the Source data file.

