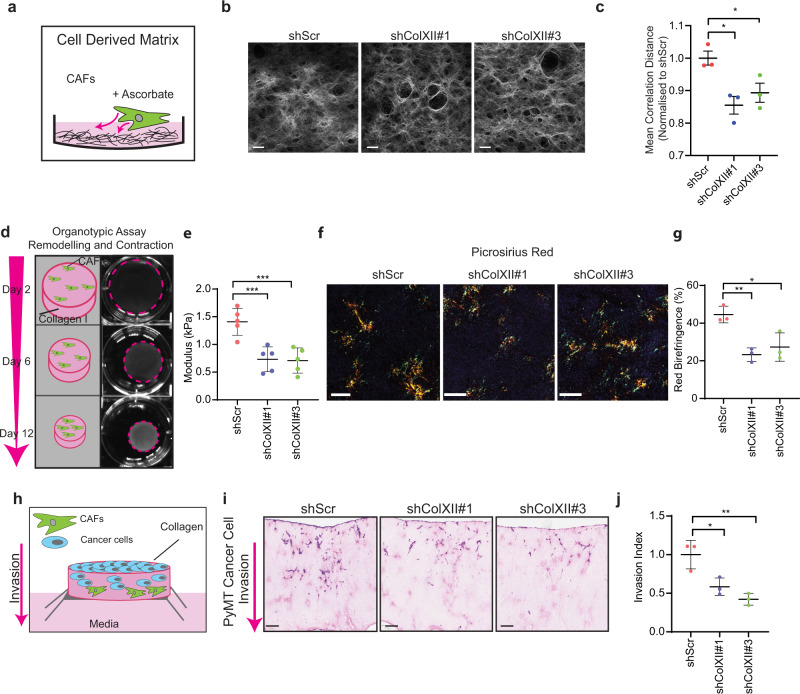
Fig. 6. Collagen XII knockdown modulates fibrillar collagen architecture and inhibits cancer cell invasion.
a Schematic representation of cell-derived extracellular matrix (CDM) secreted by cancer-associated fibroblasts (CAFs). b Representative single-plane images of second harmonic generation (SHG) multi-photon signal of CDMs produced by CAF scrambled control (shScr) and two stable collagen XII knockdown lines (shColXII#1 and #3) from n = 3 biologically independent experiments. c Grey-level co-occurrence matrix (GLCM) analysis of mean correlation distance of collagen I structure in CAF-derived CDMs following collagen XII knockdown. Mean ± SD, n = 3 biologically independent experiments, *p < 0.05, shScr vs. shColXII#1 p = 0.14; shScr vs. shColXII#3 p = 0.049; One-way ANOVA with Dunnett’s multiple comparisons test. d Schematic representation of 3D organotypic matrix remodelling by fibroblasts (scale bar = 7 mm). Representative of n = 5 biologically independent experiments. e Bulk modulus (stiffness) of organotypic matrices remodelled by control (shScr) or collagen XII knockdown (shColXII#1, shColXII#3) CAFs at day 12 as measured by unconfined compression analysis. Mean ± SD, n = 5 biologically independent experiments, ***p < 0.001, shScr vs. shColXII#1 p = 0.0006; shScr vs. shColXII#3 p = 0.0008; one-way ANOVA with a Dunnett’s multiple comparisons test. f Representative images of birefringence signal from picrosirius-red-stained organotypic matrices generated by control (shScr) or collagen XII knockdown (shColXII#1, shColXII#3) CAFs imaged under polarising light (scale bar = 100 µm) from n = 3 biologically independent experiments. g Quantification of the red birefringence signal area for picrosirius-red-stained organotypic matrices remodelled by control (shScr) or collagen XII knockdown (shColXII#1, shColXII#3) CAFs. Mean ± SD, n = 3 biologically independent experiments, *p = 0.014, **p = 0.0054, one-way ANOVA with a Dunnett’s multiple comparisons test, h Schematic representation of experimental set-up of cancer cell invasion into CAF-remodelled organotypic matrices. i Representative histological images (H&E) (n = 3) of PyMT cancer cell invasion into organotypic matrices remodelled by control (shScr) or collagen XII knockdown (shColXII#1, shColXII#3) CAFs (scale bar = 100 µm). j Quantification of PyMT cancer cell invasive index into organotypic matrices. Mean ± SD, n = 3 biologically independent experiments, *p = 0.020, **p = 0.0042, One-way ANOVA with a Tukey’s multiple comparison test. Source data are provided in the Source data file.

