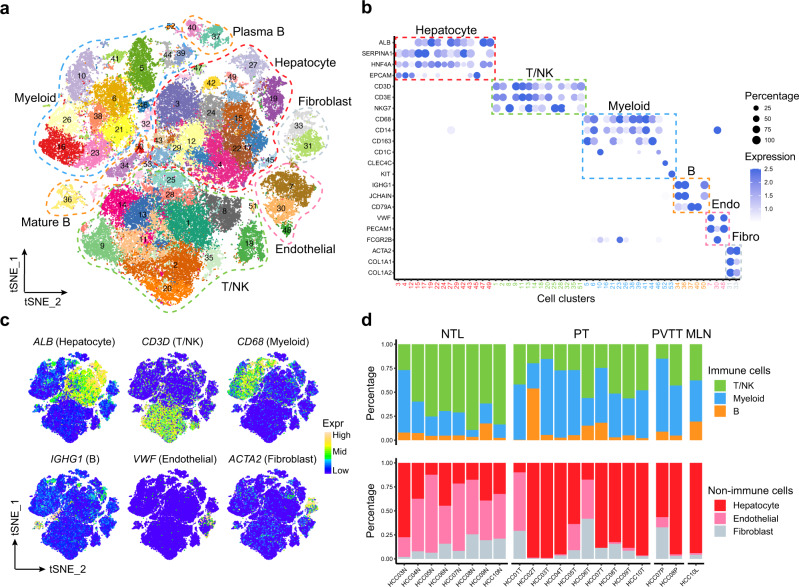
Fig. 1. scRNA-seq profiling of multicellular ecosystem in primary and metastatic HCC and non-tumor liver tissues.
a The T-distributed Stochastic Neighbor Embedding (tSNE) plot of 53 cell clusters from the multicellular ecosystem of 10 HCC patients. Cells from different clusters are marked by colors. Major cell types are marked by dashed lines. b Dotplot showing the percentage of expressed cells and average expression levels of canonical marker genes of major cell types in 53 cell clusters. Endo Endothelial, Fibro Fibroblast. c The tSNE plots showing the expression levels of signature genes of six major cell types, colored by gene expression. Mid, middle. d Stacked barplots showing the percentages of major immune (top) and non-immune (bottom) cell types in each sample. Samples are ordered based on tissue types. NTL non-tumor liver, PT primary tumor, PVTT portal vein tumor thrombus, MLN metastatic lymph node. Source data are provided as a Source Data file.

