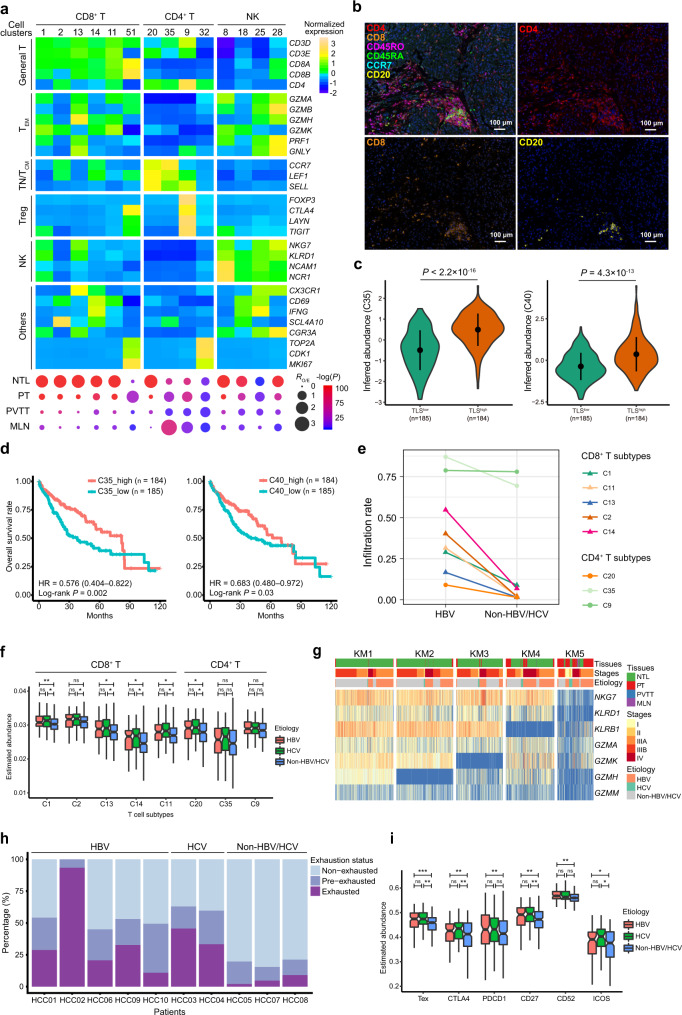
Fig. 2. Characterization of the heterogeneous T cell populations in HCC.
a Expression profiles of canonical marker genes of T/NK subtypes (top) and their tissue preferences (bottom). Dot size indicates the ratios of the observed versus expected cell numbers (RO/E); Dot color indicates the log-transformed P values determined by two-sided Chi-squared test. TEM effector memory T, TN Naïve T, TCM central memory T, Treg regulatory T, NTL non-tumor liver, PT primary tumor, PVTT portal vein tumor thrombus, MLN metastatic lymph node. b Multi-color IHC staining to validate the presence of CD4+ TCM, CD8+ T and CD20+ B cells aggregates in early tertiary lymphoid structures (E-TLSs) in the tumor of patient HCC03. c Differential abundance of CD4+ TCM (C35) or CD20+ B (C40) in TLSlow and TLShigh tumors from TCGA-LIHC cohort estimated using a 9-gene TLS signature. d Higher abundance of CD4+ TCM (C35) or CD20+ B (C40) predicts increased overall survival rates of patients in the TCGA-LIHC cohort. e The infiltration rates of T cell subtypes in tumors of HBV-infected (n = 5) and non-HBV/HCV-infected (n = 3) HCC patients, measured by dividing the number of T cells in tumoral tissues with the number of the whole T cell subtype. f The inferred abundances of T cell subtypes in HBV-infected (n = 104), HCV-infected (n = 56) and non-HBV/HCV-infected (n = 216) tumor samples in the TCGA-LIHC cohort. g The k-means clustering of cytotoxic T lymphocytes (CTLs) based on the expression levels of CTLs effector molecules. h Proportions of the exhausted, pre-exhausted and non-exhausted CTLs in HBV-, HCV- or non-HBV/HCV-infected patients. i The differential abundances of exhausted T cells (Tex) and differential expression levels of exhaustion markers in HBV-infected (n = 104), HCV-infected (n = 56) and non-HBV/HCV-infected (n = 216) tumor samples in the TCGA-LIHC cohort. In c, f and i, the statistical significance was determined by two-sided Student’s t test. ns, not significant, *P < 0.05, **P < 0.01 and ***P < 0.001. Boxplot elements are defined in the Methods section (data visualization). Source data are provided as a Source Data file.

