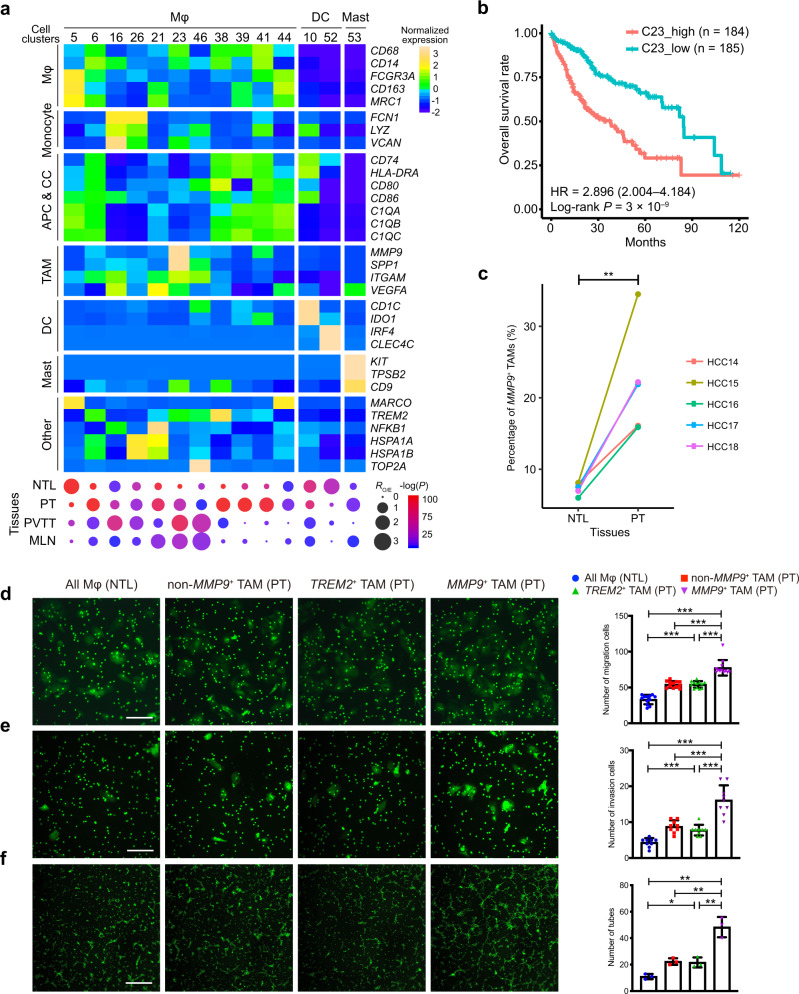
Fig. 3. Characterization of the heterogeneity of tumor-infiltrating macrophages.
a Heatmap (top) showing the expression profiles of canonical marker genes of myeloid cell subtypes and dotplot (bottom) showing their tissue preferences. Dot size indicates the ratios of the observed versus expected cell numbers (RO/E); Dot color indicates the log-transformed P values determined by two-sided Chi-squared test. APC antigen-presenting cell, CC complement cascade, DC dendritic cell, TAM tumor-associated macrophage, Mast mastocyte, Mφ macrophage. b Higher abundances of MMP9+ TAMs (C23) in tumors predict worse overall survival rates in HCC patients from the TCGA-LIHC cohort. Hazard ratio (HR) (with 95% confidence interval in brackets) was calculated using a Cox proportional hazards regression model, and the statistical significance was determined by log-rank test. c The proportions of MMP9+ TAMs in primary tumor (PT) tissues are significantly higher than those in non-tumor liver (NTL) tissues, which were measured by fluorescence-activated cell sorting (FACS) in five HCC patients. The statistical significance was determined by two-sided paired Student’s t test. **P < 0.01. Huh7 cells treated with MMP9+ TAMs isolated from the PT tissues show increased abilities of d migration (n = 12 biological replicates) and e invasion (n = 9 biological replicates) compared to the control groups treated with the TREM2+ TAMs, non-MMP9+ TAMs isolated from the PT tissues and the whole macrophage populations isolated from the NTL tissues, respectively. Error bars, mean ± sd. f Human umbilical vein endothelial cells (HUVECs) treated with the MMP9+ TAMs show more tubes formation than the control groups treated with the TREM2+ TAMs, non-MMP9+ TAMs isolated from the PT tissues and the whole macrophage populations isolated from NTL tissues, respectively (n = 3 biological replicates). The scale bars represent 20 μm. Error bars, mean ± sd. In d–f, the statistical significance was determined by two-sided Student’s t test. *P < 0.05, **P < 0.01 and ***P < 0.001. Source data are provided as a Source Data file.

