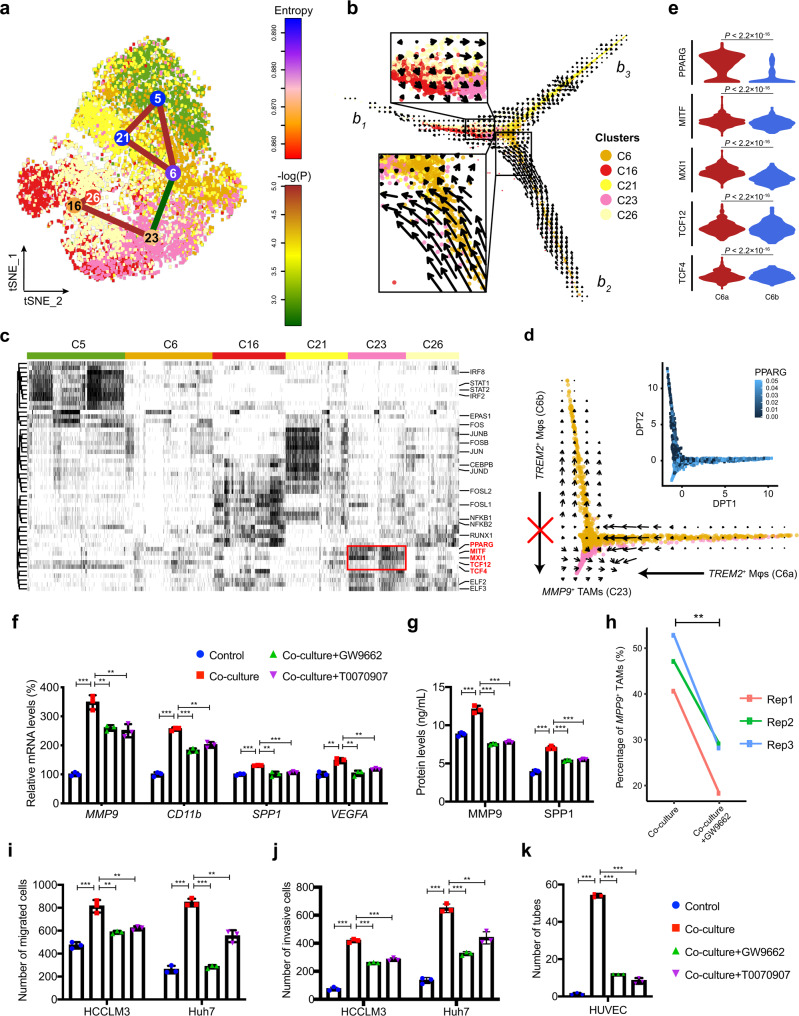
Fig. 4. The differentiation of MMP9+ TAMs from distinct macrophage subpopulations is induced by PPARγ.
a Macrophage lineage reconstruction by StemID2. Transcriptome entropy of each macrophage cluster is denoted by node color. Significance of links is calculated as described in the Methods section (StemID-based cellular lineage analysis) and is denoted by edge color. b RNA velocities are visualized on the diffusion pseudotime (DPT) projection of tumor-infiltrating macrophages. Arrows indicate the RNA velocity flow. c Heatmap showing the active status of transcription factors (TFs) across macrophage clusters. TFs specifically activated in MMP9+ TAMs (C23) are marked by the red box. d RNA velocities between the MMP9+ (C23) and TREM2+ macrophages (C6) are visualized on DPT projection. Differential activity of PPARG in two TREM2+ macrophage subpopulations (C6a and C6b) is visualized by heatmap. Mφ, macrophage; TAM, tumor-associated macrophage. e The differential activities of five MMP9+ TAM-related TFs between two TREM2+ macrophage subpopulations (C6a and C6b). The statistical significance was determined by unpaired two-tailed t test. f Expression levels of MMP9+ TAMs markers measured by qRT-PCR in THP-1 macrophages cultured alone (Control), co-cultured with HCCLM3 cells (Co-culture+DMSO), or co-cultured in the presence of the PPARγ inhibitors GW9662 (Co-culture+GW9662) or T0070907 (Co-culture+T0070907). g Protein levels of MMP9+ TAMs markers MMP9 and SPP1 measured by ELISA in the culture media of THP-1 macrophages of different groups. h The proportion of MMP9+ macrophages in co-cultured THP-1 macrophages without treatment of GW9662 are significantly higher than those in THP-1 macrophages treated by GW9662, measured by FACS. The statistical significance was determined by two-sided paired Student’s t test. Migration i and invasion j abilities of HCCLM3 and Huh7 cells treated with different sets of THP-1 macrophages. k Number of tubes formed by HUVECs treated with different sets of THP-1 macrophages. In f–k, data was collected from 3 biological replicates. In e–g, i–k, the statistical significances were determined by two-sided unpaired Student’s t test. Error bars in f, g, i–k indicate mean ± sd. *P < 0.05, **P < 0.01 and ***P < 0.001. Source data are provided as a Source Data file.

