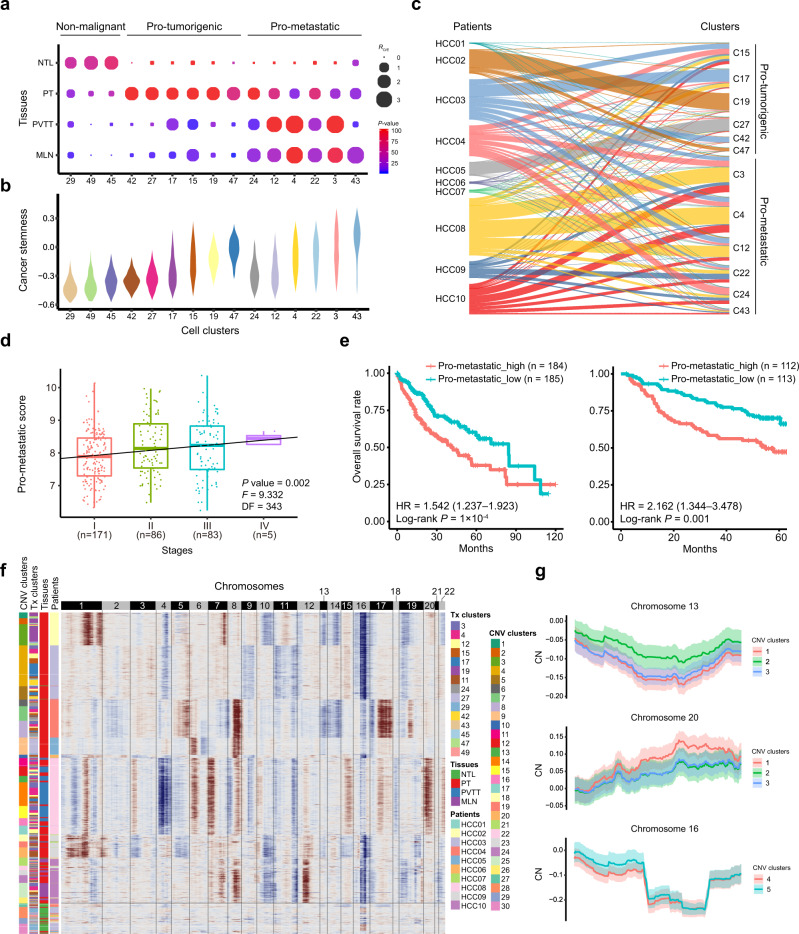
Fig. 5. The intratumoral heterogeneity of malignant hepatocytes at the transcriptomic and genomic levels.
a The tissue distribution preferences of three non-malignant, six pro-tumorigenic and six pro-metastatic hepatocyte clusters in NTL, PT, PVTT and MLN tissues. Dot size indicates the ratios of the observed versus expected cell numbers (RO/E), and dot color indicates the log-transformed P values determined by two-sided Chi-squared test. b Cancer stemness of each cell cluster was scored per cell by gene set variation analysis (GSVA) on the basis of the cancer stemness signature in hepatocyte clusters. c Sankey diagram showing the percentages of hepatocyte clusters among HCC patients and vice versa. d Significant correlation between HCC stages and pro-metastatic scores across the HCC tumors in the TCGA-LIHC cohort. A linear regression model was used for data fitting and the significance of the model was determined by two-sided F-test. DF, degree of freedom. e Higher pro-metastatic score of tumors predicts worse overall survival rates of HCC patients in both the TCGA-LIHC (left) and the Fudan cohorts (right). Hazard ratio (HR) with 95% confidence interval in brackets was calculated using a Cox proportional hazards regression model, and the statistical significance was determined by log-rank test. f Chromosomal landscape of the inferred single-cell CNV profiles in hepatocytes. By use of k-means clustering analyses on the basis of single-cell CNV profiles, the hepatocytes were divided into 30 CNV clusters. The number of clusters was determined based on the average silhouette width scores. Unsupervised k-means clustering can distinguish the malignant hepatocytes (CNV clusters 1–26) from the non-malignant ones (CNV clusters 27–30) separated by the horizontal lines. CNV, copy number variation. Tx Transcriptome. g Inferred copy-number (CN) profiles of subclones in patient HCC02 at chromosome 13 (top) and 20 (middle), and HCC03 at chromosome 16 (bottom). The solid curve and colored band indicate mean ± standard deviation (s.d.) of CN in each chromosomal position across single cells. Source data are provided as a Source Data file.

