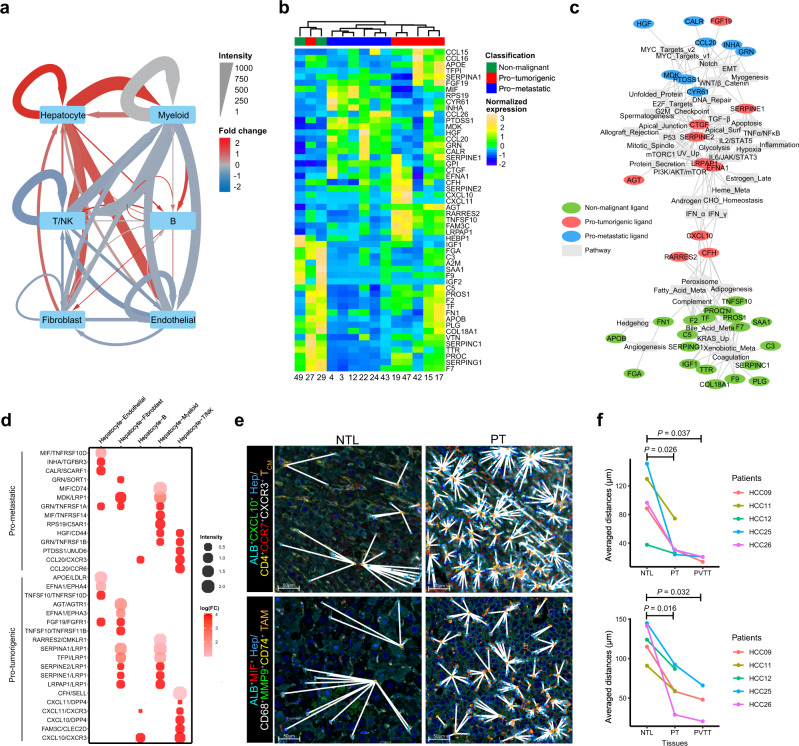
Fig. 6. Malignant hepatocytes have multifaceted functions in shaping the HCC microenvironment.
a A directed network showing the differential ligand-receptor (L-R) interaction intensities among the six major cell types between the primary tumor (PT) and non-tumor liver (NTL) tissues. The averaged L-R interaction intensities in the PT and NTL tissues are represented by edge width. The fold changes of L-R interaction intensities are represented by edge color, with red denoting upregulated and blue denoting down-regulated in PT as compared to NTL tissues. b Heatmap showing the expression levels of all hepatocyte-expressed ligands (rows) across the malignant hepatocyte clusters (columns). Ligands and malignant hepatocyte clusters are ordered based on hierarchical clustering. c A bipartite network linking the hepatocyte-expressed ligands (colored ellipses) to the correlated pathways (gray rectangles). Each edge indicates a significant correlation between a ligand and a pathway (P < 0.01, Spearman’s ρ test). Meta metabolism, EMT epithelial-mesenchymal transition, UV ultraviolet, v1 version 1, v2 version 2. d Dotplot showing the pro-tumorigenic and pro-metastatic L-R interactions that are significantly upregulated in PT as compared to NTL tissues. Dot size indicates the averaged L-R interaction intensity; Dot color indicates the log-transformed fold change of intensities. e Multi-color IHC for the co-localization analysis of interacting cell populations mediated by L-R interactions CXCL10/CXCR3 (upper) and MIF/CD74 (lower) in the non-tumoral liver (NTL) and primary tumor (PT) tissues of patient HCC26. The nearest cells between two interacting cell populations are linked by white solid lines. The experiment was repeated independently 5 times with similar results. Hep, hepatocyte; TCM, central memory T TAM, tumor-associated macrophage. f Average distances between interacting cell populations mediated by L-R pairs CXCL10/CXCR3 (upper) and MIF/CD74 (lower) in the NTL, PT and PVTT tissues of five patients (HCC09, HCC11, HCC12, HCC25, and HCC26), among whom HCC09, HCC25, and HCC26 accompanied PVTT. The statistical significances were determined by two-sided paired Student’s t test. *P < 0.05, **P < 0.01 and ***P < 0.001. Source data are provided as a Source Data file.

