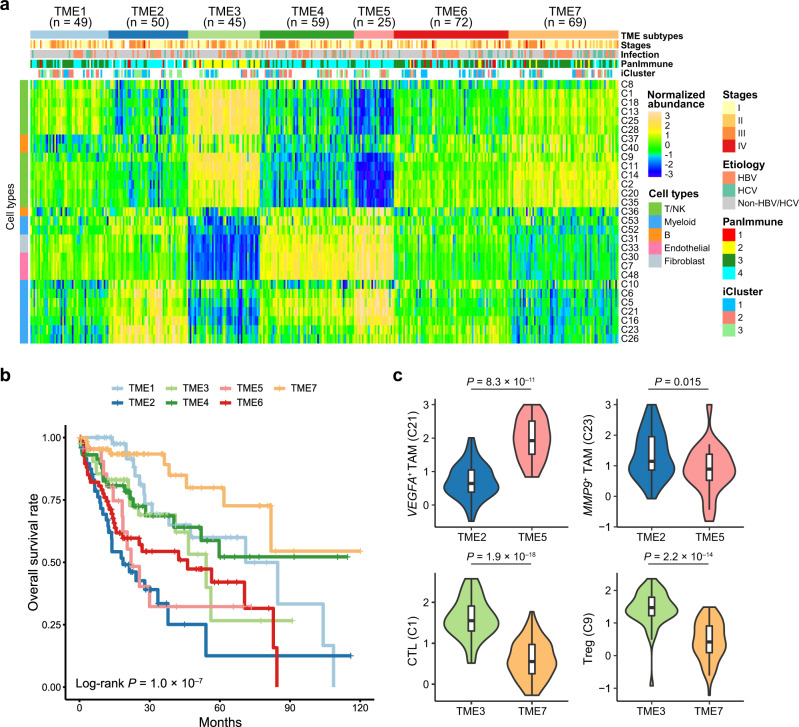
Fig. 7. Bulk tissue cell type deconvolution analysis shows seven TME subtypes of HCC.
a Heatmap showing seven tumor microenvironment (TME) subtypes of HCC patients (TME1–7) with distinct composition of immune and stromal cell subtypes inferred from bulk RNA-seq data of the TCGA-LIHC cohort. Rows represent the 29 patient-shared immune and stromal cell subtypes identified by the scRNA-seq data in this study. Columns represent the 369 HCC patients from the TCGA-LIHC cohort. Tumor-node-metastasis (TNM) stages, etiology, PanImmune subtypes and iCluster subtypes are annotated by colors at the top of the heatmap. b Kaplan–Meier survival analysis shows that the seven TME subtypes exhibit distinct overall survival outcomes. The statistical significance was determined by log-rank test. c The distribution of the normalized abundances of representative cell subtypes (VEGFA+ and MMP9+ TAMs, top; CTLs and Tregs, bottom) between TME subtypes TME2 (n = 50 patients) versus TME5 (n = 25 patients), and TME3 (n = 45 patients) versus TME7 (n = 69 patients), respectively. In set boxplot elements are defined in the Methods section (section on data visualization). The statistical significances were determined by two-sided Student’s t test. CTL cytotoxic T lymphocytes, TAM tumor-associated macrophage, Treg regulatory T cell. Source data are provided as a Source Data file.

