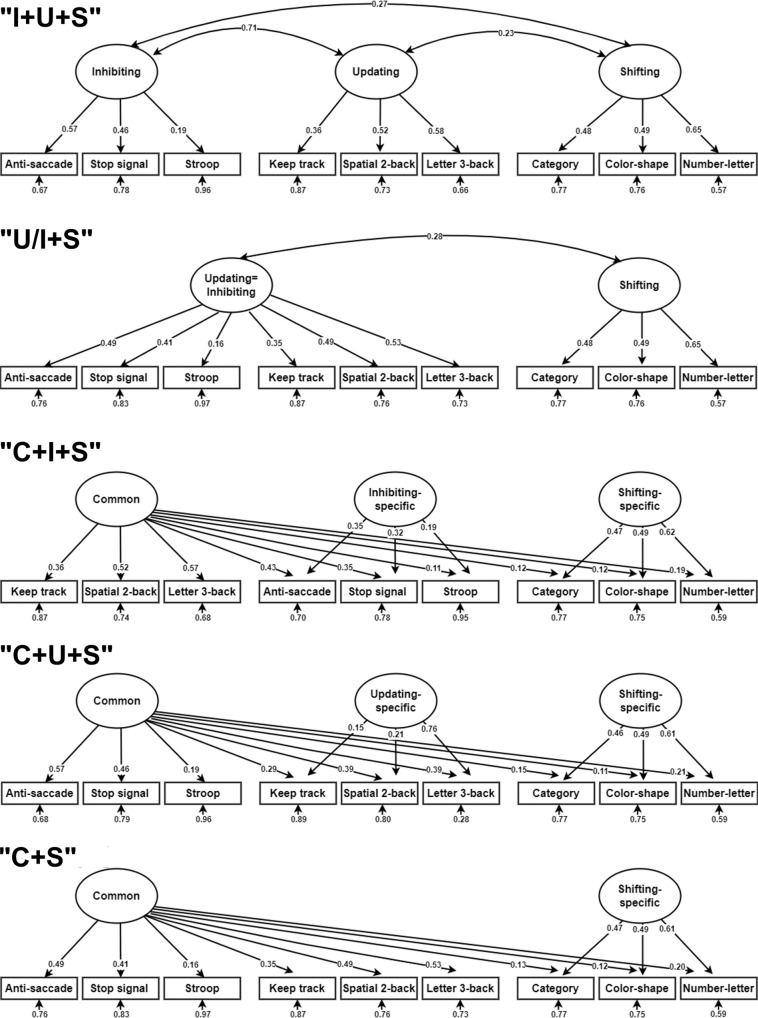
Fig. 2. EF latent variable models (the five good-fit models).
The numbers on the one-way arrows are standardized factor loadings between latent variables and manifest variables from the nine tasks. All the loadings had P values < 0.05; uncorrected; two-sided test (hereafter). The numbers on the one-way arrows at the bottom of the manifest variables are error terms. Significantly correlated pairs of latent variables are connected with double-arrowed curves and associated correlation coefficients are shown. Exact P values are provided in Source Data file. See Table 1 for fit statistics for the five models. Source data are provided as a Source Data file.

