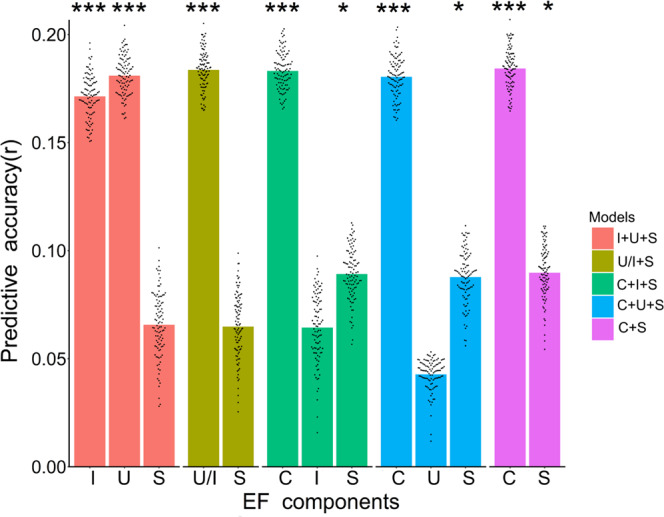
Fig. 3. Individual connectivity patterns predict EF factor scores across the five good-fit models.

The presented prediction accuracies (r) were obtained using tenfold cross-validation analyses and averaged from 100 random splits of the data (n = 870 subjects), each point (in total 100) overlaying the bar gragh represents the predictive accuracy of each tenfold cross-validation, P values were estimated using 10,000 permutations. The significant results after FDR-BH correction are noted with asterisks (***P values < 0.001, *P values < 0.05, exact P values are provided in Source Data file, one-sided permutation test). I inhibiting or inhibiting-specific, U updating or updating-specific, S shifting or shifting-specific, U/I (updating = inhibiting), C common. Source data are provided as a Source Data file.
