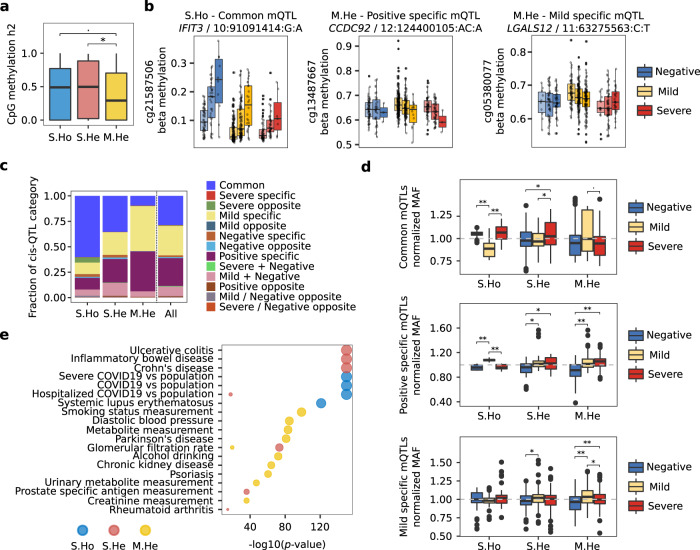
Fig. 4. Genetics contributes differentially to progressive and mild specific DNA methylation changes.
a Genetic contribution in terms of the fraction of the variance explained (heritability, h2) of individual CpG methylation changes is shown by DNA methylation module. Statistical differences are assessed by means of two-tailed Wilcoxon test p-values. b Three significant meQTLs regulating DNA methylation levels are shown divided by severity group and genotype. From left to right, a common meQTL for all three severity groups in the S.Ho module, a positive specific meQTL and a mild specific meQTL for M.He module are depicted. c Fraction of meQTL categories are plotted by module and for all significant DMCs together. d Normalized MAFs for the largest meQTL categories (common meQTLs, positive specific meQTLs and mild specific meQTLs) represented in at least three modules (S.Ho, S.He and M.He) are shown divided by severity group. Two-tailed Wilcoxon test p-values were calculated between severity groups. e Enrichment of GWAS catalog and COVID-19 Host Genetics Initiative associated SNPs are shown by CpG module (two-tailed hypergeometric p-value < 1e-10). MeQTL analyses were performed on 101 negative SARS-CoV2 lab tested individuals, 360 positive individuals with mild symptoms and 113 positive individuals with severe symptoms. In the boxplots, the center line denotes the median value, the box contains 25th to 75th percentiles of the dataset and the whiskers extend up to ± 1.5*IQR. S.Ho module is depicted blue, S.He in red and M.He in yellow. Severe, mild and negative individual groups are colored in red, yellow and blue respectively.

