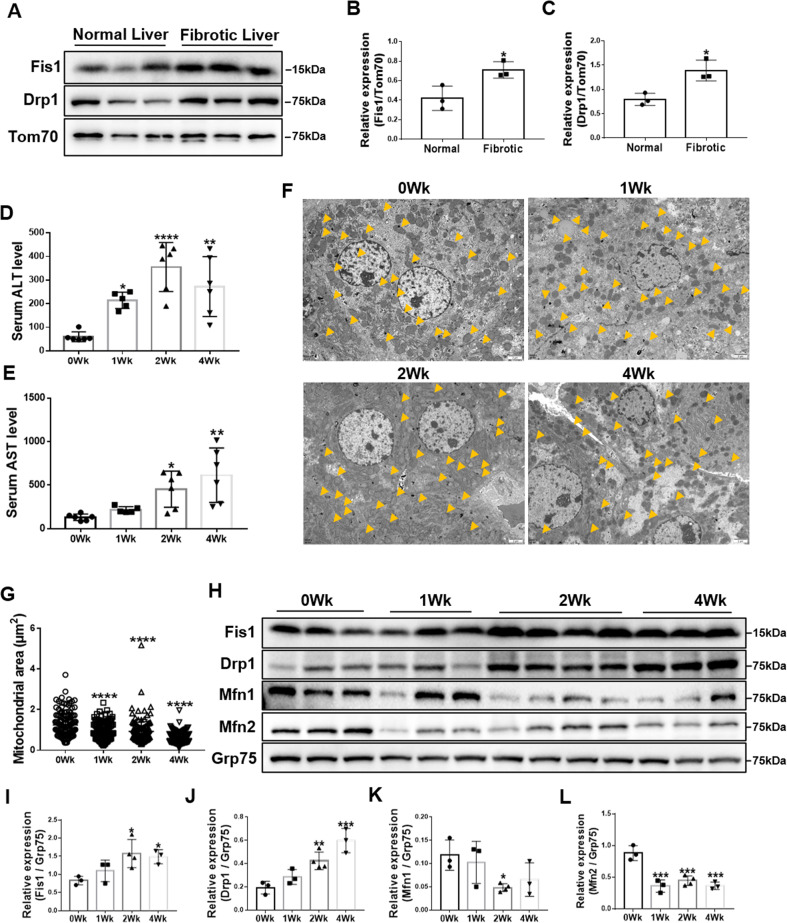
Fig. 1. Imbalanced mitochondrial dynamics in fibrotic livers.
A–C Immunoblotting and statistical analyses for relative expressions of Fis1 and Drp1 in mitochondria from normal human and fibrotic livers (n = 3/group). Tom70 was probed as a mitochondrial marker. Two-tailed unpaired t-test. D, E Serum ALT and AST levels of olive oil- and CCl4-treated mice (n = 5-6/group). Data are expressed as means ± SD. Ordinary one-way ANOVA with Dunnett’s multiple comparisons test. F, G Representative transmission electron microscopy images and quantification of the mitochondrial dynamics in livers from olive oil- and CCl4-treated mice. Scale bar, 2 μm. Mitochondria are indicated by arrows. Mitochondria in the fibrotic livers were smaller and shorter. Data are expressed as mean ± SD from 120 to 149 mitochondria/group. Ordinary one-way ANOVA with Turkey’s multiple comparisons test. H–L Immunoblotting and statistical analysis for relative expressions of Fis1, Drp1, Mfn1, and Mfn2 in the mitochondria from olive oil- and CCl4-treated mice. Statistical analyses showed upregulation of Fis1 and Drp1 and downregulation of Mfn1 and Mfn2. Ordinary one-way ANOVA with Dunnett’s multiple comparisons test. *P < 0.05; **P < 0.01; ***P < 0.001; ****P < 0.0001.

