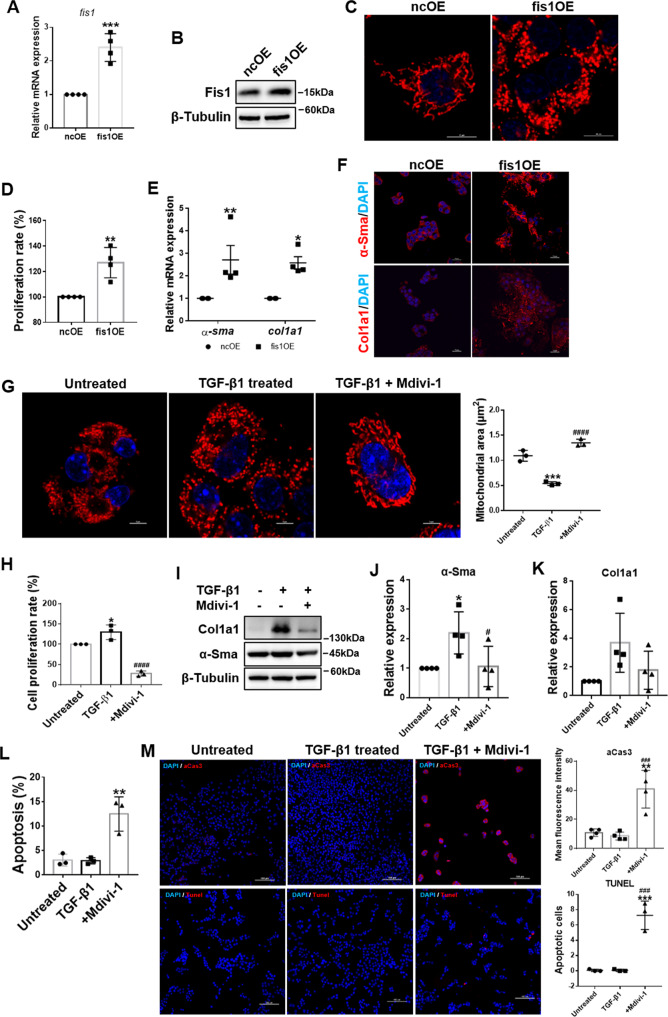
Fig. 3. Mitochondrial fission drives HSC activation.
A Relative mRNA expression of fis1 in fis1-overexpressed and control HSCs were detected by qRT-PCR and normalized to Rps18. Two-tailed unpaired t-test. B Immunoblotting analysis for relative expressions of Fis1. C Representative confocal immunofluorescence microscopy of the mitochondrial dynamics in fis1-overexpressed and control HSCs. Scale bar, 10 μm. D Measured cell proliferation rate. Cell proliferation rate in control HSCs was taken as 100%. Two-tailed unpaired t-test. E Relative mRNA expressions of α-Sma and Col1a1 were detected by qRT-PCR and normalized to Rps18. Two-way ANOVA with Sidak’s multiple comparisons test. F Representative confocal immunofluorescence microscopy of α-Sma (red) and Col1a1 (red). Scale bar, 10 μm. G Representative confocal immunofluorescence microscopy and quantification of the mitochondrial dynamics in viable HSCs. Fragmented mitochondria in active HSCs were reversed to an elongated state after Mdivi-1 treatment. Data are expressed as mean ± SD. Ordinary one-way ANOVA with Turkey’s multiple comparisons test. H Measured cell proliferation rate. Cell proliferation rate in quiescent HSCs was taken as 100%. Ordinary one-way ANOVA with Turkey’s multiple comparisons test. I–K Immunoblotting and statistical analysis for α-Sma and Col1a1, normalized to β-Tubulin. Ordinary one-way ANOVA with Turkey’s multiple comparisons test. L, M Apoptosis was detected by flow cytometry (L) and immunofluorescence (M), stained by active caspase 3 (upper) or Tunel (lower). Ordinary one-way ANOVA with Turkey’s multiple comparisons test. Data are shown as means ± SD. The results were all confirmed by at least three independent experiments. *P < 0.05; **P < 0.01; ***P < 0.001 vs. ncOE or Untreated; ###P < 0.001; ####P < 0.0001 vs. TGF-β1-treated group.

