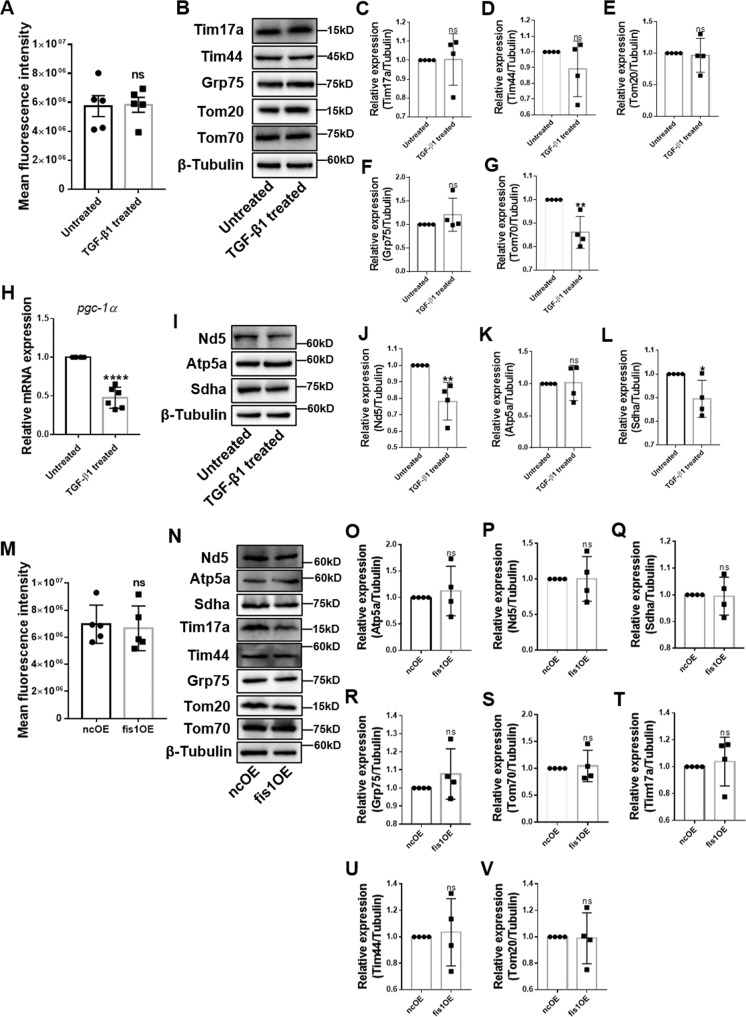
Fig. 7. Mitochondrial mass in active HSCs.
A Mitochondria were stained by MitoTracker Deep Red and assessed by flow cytometry. B–G Immunoblotting and statistical analyses for relative expression of mitochondrial proteins in the outer mitochondrial membrane, inner mitochondrial membrane, and matrix. H Relative mRNA level of pgc-1α was measured by qRT-PCR. Data are normalized to Rps18. I–L Expression of subunits of ETC were detected by immunoblotting and statistical analyses were conducted. M Mitochondria were stained by MitoTracker Deep Red and measured by flow cytometry. N–V Mitochondrial proteins were assessed by immunoblotting and statistical analyses were conducted. Data are means ± SD (n ≥ 4/group). Data were analyzed using a two-tailed unpaired t-test. ns, not significant; *P < 0.05; **P < 0.01.

